VISIONARY PRESS
Information Graphic Visionaries 3-Book Set
Information Graphic Visionaries 3-Book Set
Couldn't load pickup availability
A new book series celebrating three spectacular data visualization creators. With new writing, complete visual catalogs, and discoveries never seen by the public.
The complete 3-book set includes
Emma Willard, Maps of History
Florence Nightingale, Mortality and Health Diagrams
Étienne-Jules Marey, The Graphic Method
See below for details on each volume.
Emma Willard, Maps of History
In history I have invented the map.”—Emma Willard, 1848
Emma Willard created new ways to understand time. Her inventions defined chronology for millions of Americans. This volume explores Willard’s legacy by republishing her graphics with new critique and context.
An original illustrated essay by historian Susan Schulten titled “A Graphic Mind” explores the influences and achievements of Emma Willard’s craft. The volume is introduced by geographer Matthew H. Edney.
The book concludes with a colorful graphic catalog that reproduces Willard’s maps of history and charts of time in three sections: atlases, classroom charts, and textbook graphics. Enclosed is an actual-size poster of her most famous work, The Temple of Time.
Hardcover printed on book cloth with gold foil stamp lettering
Dust jacket printed with PMS colors
11 × 7.8 inches (199 × 279 mm) trim size
248 pages
139 illustrations including 1 foldout map
Temple of Time poster enclosed
Printed in Italy
2022 Publication
ISBN: 979-8-9861945-0-9
Florence Nightingale, Mortality and Health Diagrams
"Whenever I am infuriated, I revenge myself with a new diagram.”— Florence Nightingale, 1857
Florence Nightingale used colorful diagrams to persuade royals and generals to adopt reforms that prevented countless deaths. This volume tells the story of exactly how she did it.
A new illustrated essay by data storyteller RJ Andrews titled “God’s Revenge Upon Murder” chronicles the motivation and craft behind Florence Nightingale and her team. The volume is introduced by Nightingale-historian Lynn McDonald.
The book concludes with a colorful graphic catalog that reproduces both of Nightingale’s coxcomb folios. A complete set of her statistical diagrams includes several foldout charts and a graphic appendix with hand-drawn drafts of her diagrams.
Hardcover cloth with gold foil stamp lettering
Partial dust jacket printed with PMS colors
11 × 7.8 inches (199 × 279 mm)
240 pages
101 illustrations including 6 foldout charts
Printed in Italy
2022 Publication
ISBN: 979-8-9861945-1-6
Étienne-Jules Marey, The Graphic Method
“These views have taught us to discern the appearances of reality.”— Étienne-Jules Marey, 1878
Étienne-Jules Marey revealed to the human eye what it cannot naturally see; changing not only science, but cinema and art too. His poetic book, titled La Méthode Graphique, was the first major treatise on data graphics and has been treasured by insiders for over a century.
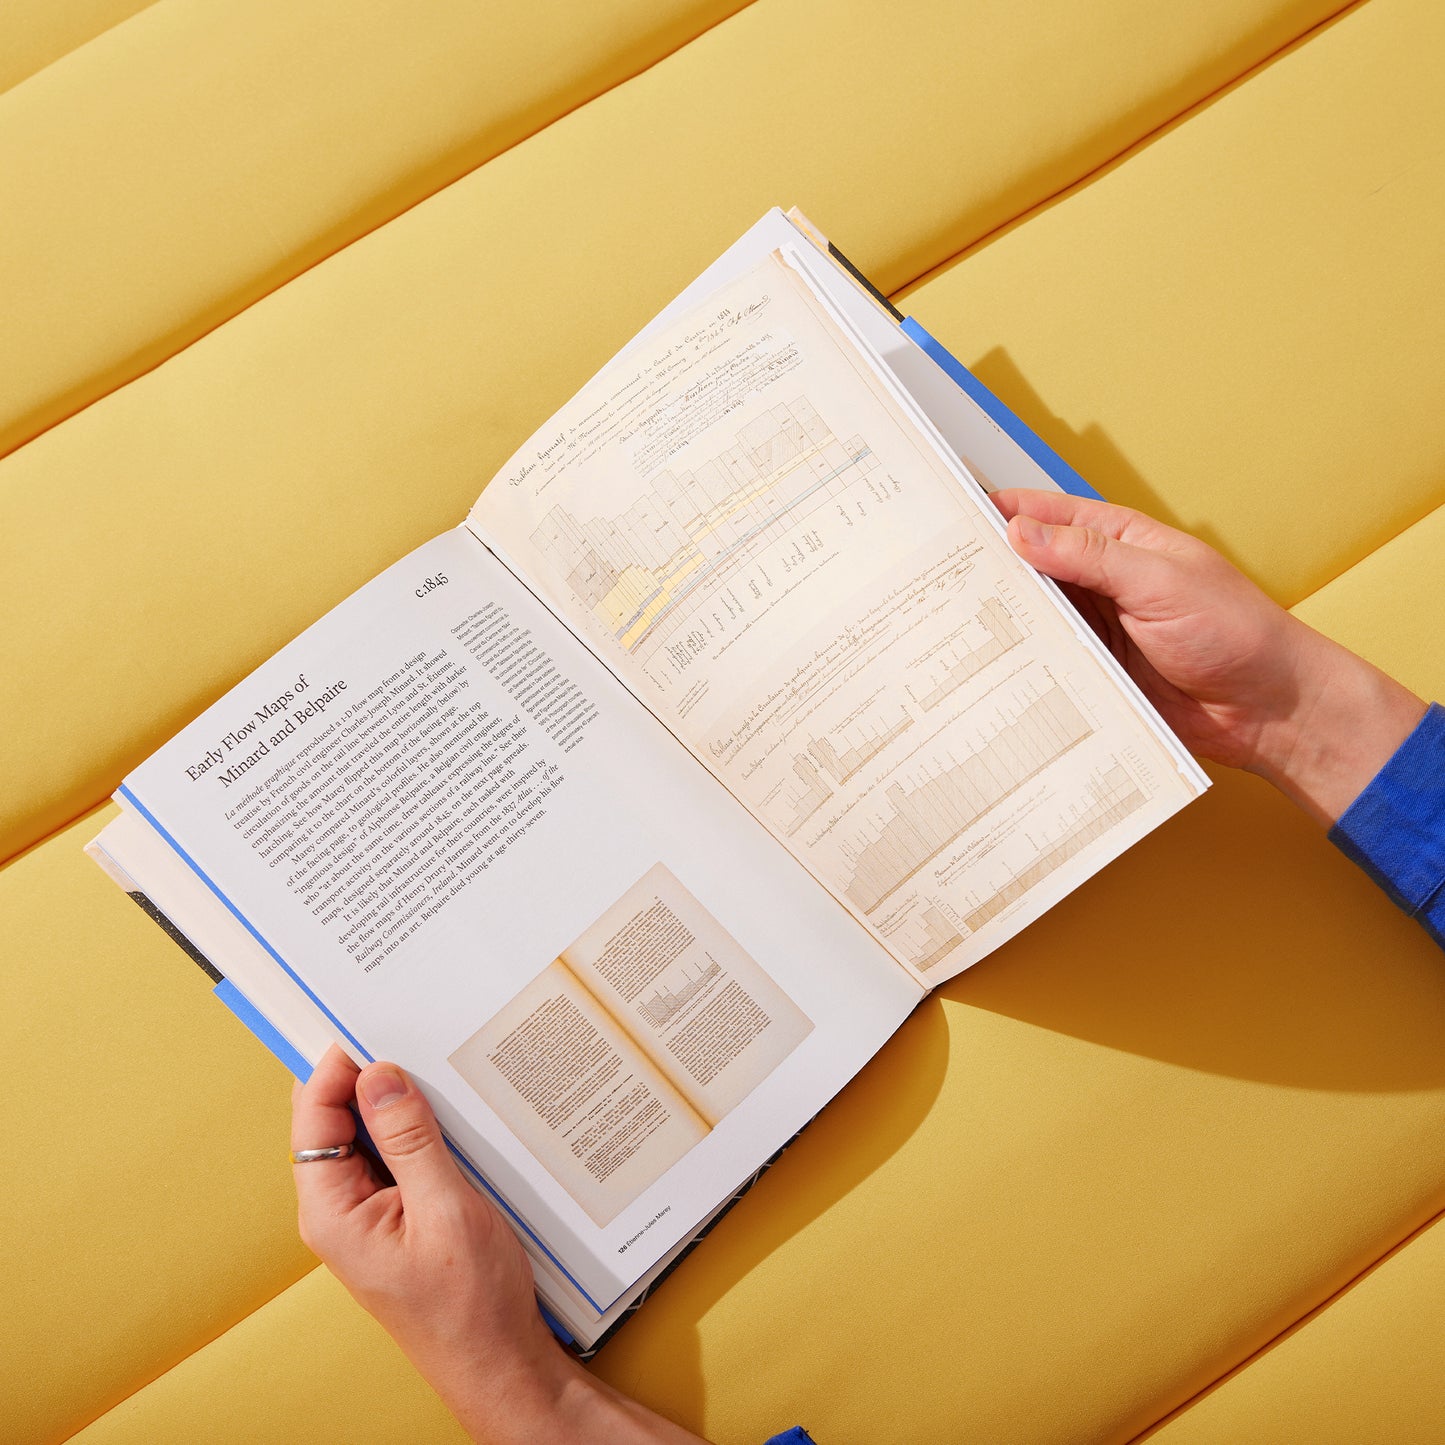
This volume publishes the first English translation of The Graphic Method, Part One. It is illustrated by original photography of Marey’s original fifty-one figures. New margin notes about historic scientists and technologies by Georges Hattab and RJ Andrews complement their translation.
The translation is introduced by a new essay on Marey’s life by Marta Braun, historian of chronophotography. The book concludes with a colorful survey of rare information graphics referenced by Marey, presented with comparative analysis between his figures and the work he sampled.
Hardcover cloth with gold foil stamp lettering
Partial dust jacket printed with PMS colors
11 × 7.8 inches (199 × 279 mm) trim size
168 pages
116 illustrations
Printed in Italy
2022 Publication
ISBN: 979-8-9861945-2-3


