VISIONARY PRESS
Emma Willard, Maps of History
Emma Willard, Maps of History
Couldn't load pickup availability
“In history I have invented the map.”—Emma Willard, 1848
Overview
Emma Willard created new ways to understand time. Her inventions defined chronology for millions of Americans. This volume explores Willard’s legacy by republishing her graphics with new critique and context.
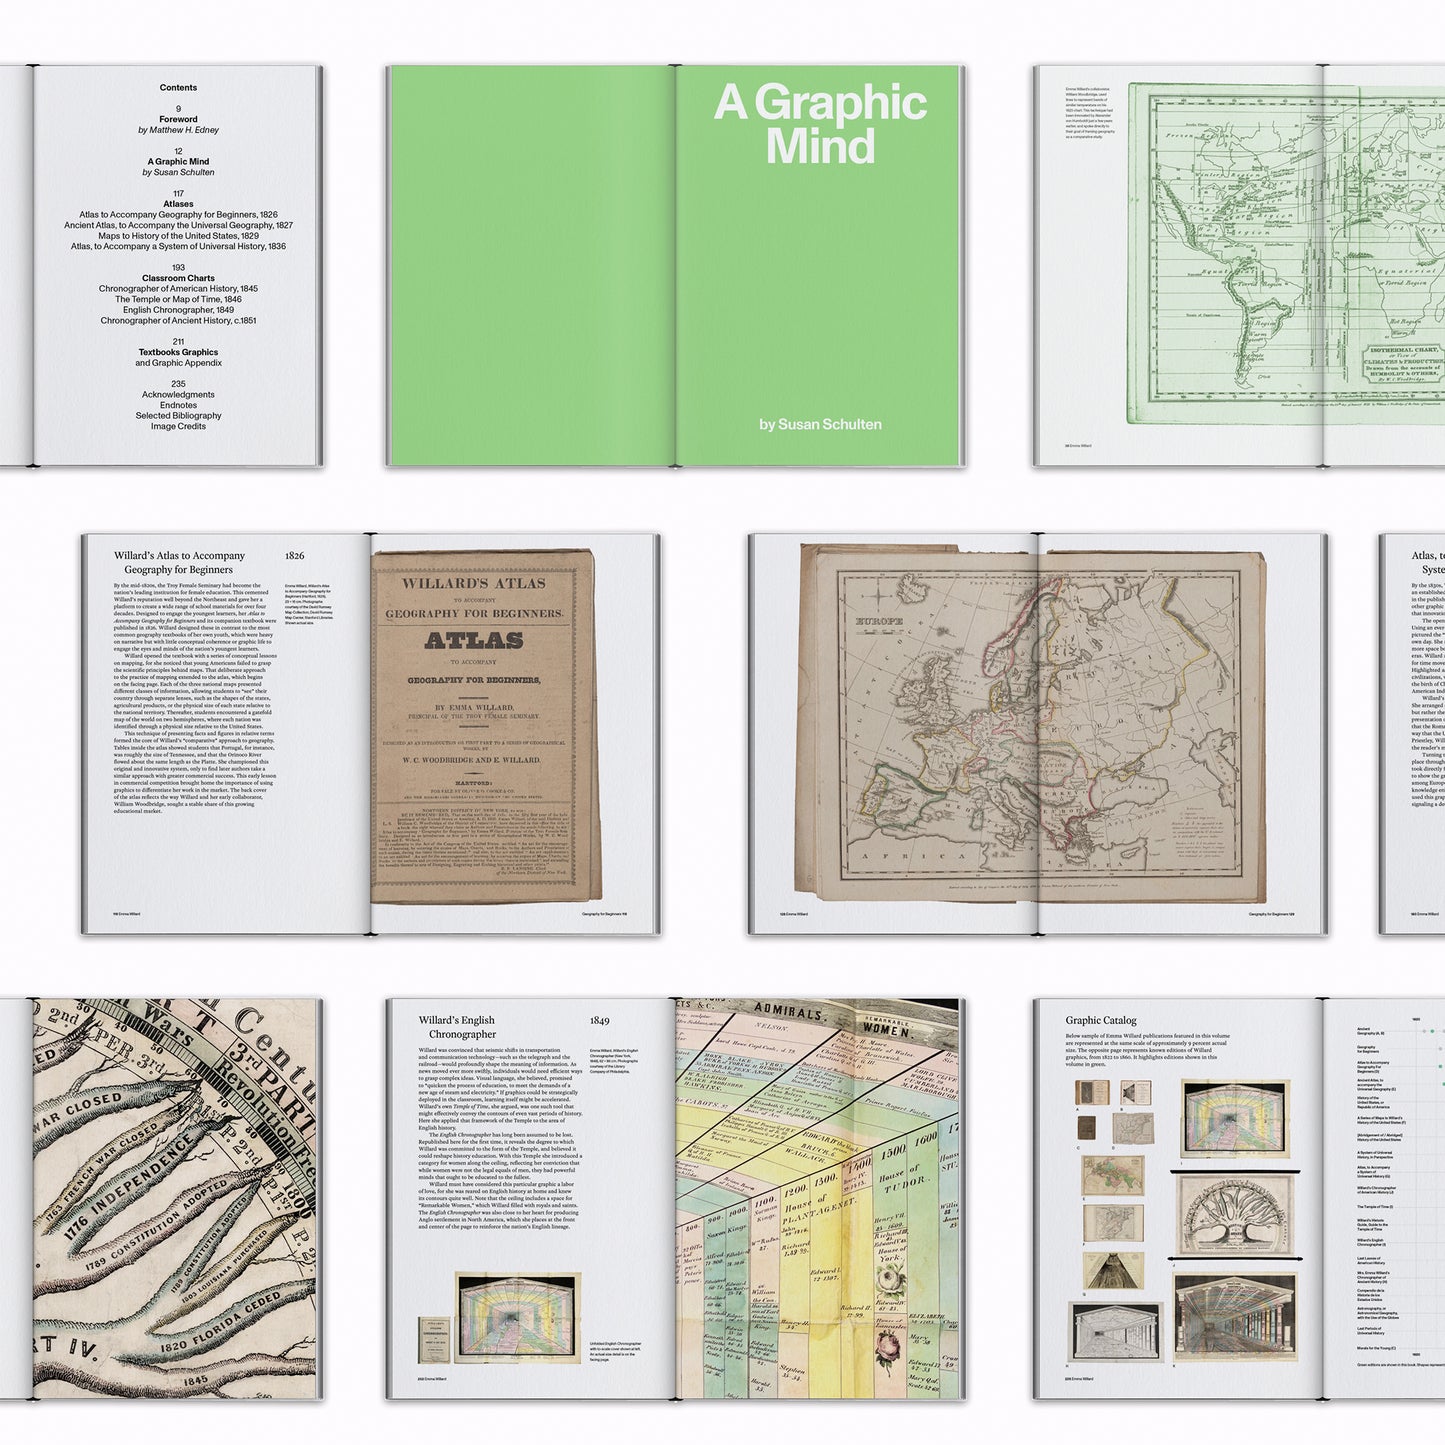
An original illustrated essay by historian Susan Schulten titled “A Graphic Mind” explores the influences and achievements of Emma Willard’s craft. The volume is introduced by geographer Matthew H. Edney.
The book concludes with a colorful graphic catalog that reproduces Willard’s maps of history and charts of time in three sections: atlases, classroom charts, and textbook graphics. Enclosed is an actual-size poster of her most famous work, The Temple of Time.
Book Details
Hardcover printed on book cloth with gold foil stamp lettering
Dust jacket printed with PMS colors
11 × 7.8 inches (199 × 279 mm) trim size
248 pages
139 illustrations including 1 foldout map
Temple of Time poster enclosed
Printed in Italy
2022 Publication
ISBN: 979-8-9861945-0-9
Contents
Foreword by Matthew H. Edney
“A Graphic Mind” by Susan Schulten
Atlases:
Atlas to Accompany Geography for Beginners, 1826
Ancient Atlas, to Accompany the Universal Geography, 1827
Maps to History of the United States, 1829
Atlas, to Accompany a System of Universal History, 1836
Classroom Charts:
Chronographer of American History, 1845
The Temple or Map of Time, 1846
English Chronographer, 1849
Chronographer of Ancient History, c.1851
Textbooks Graphics and Appendix
About the Editor
Susan Schulten PhD is Professor of History at the University of Denver. She is the author of The Geographical Imagination in America, 1880–1950; Mapping the Nation: History and Cartography in Nineteenth-Century America; and A History of America in 100 Maps, all published with the University of Chicago Press. She is also co-editor, with Elliott Gorn, of the two-volume Constructing the American Past, published by Oxford University Press. Schulten uses old maps to tell new stories about history. Her research has been funded by the National Endowment for the Humanities and the John Simon Guggenheim Foundation.
About the Series
This volume is part of Information Graphic Visionaries, a book series celebrating spectacular data visualization creators with original research, new writing, and beautiful visual catalogs. Inaugural volumes also include Florence Nightingale, Mortality and Health Diagrams and Étienne-Jules Marey, The Graphic Method.


