VISIONARY PRESS
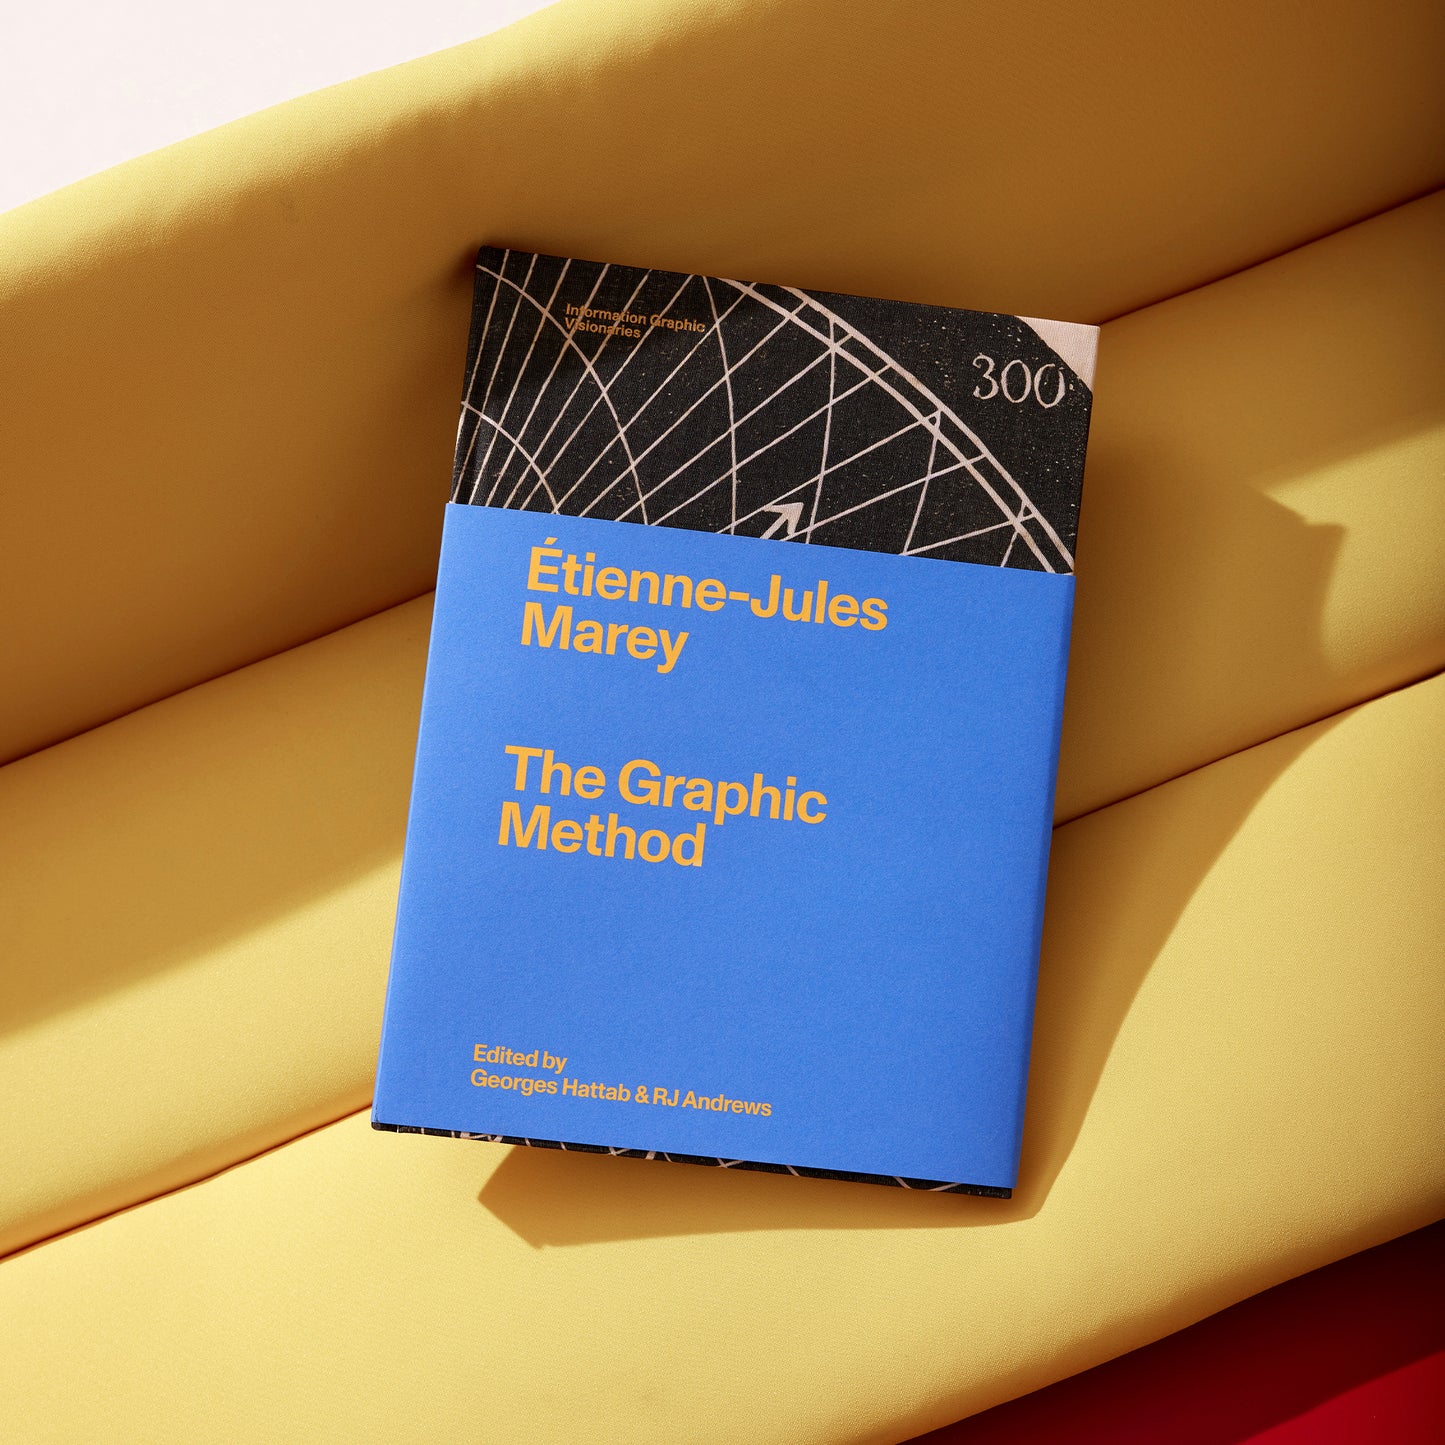
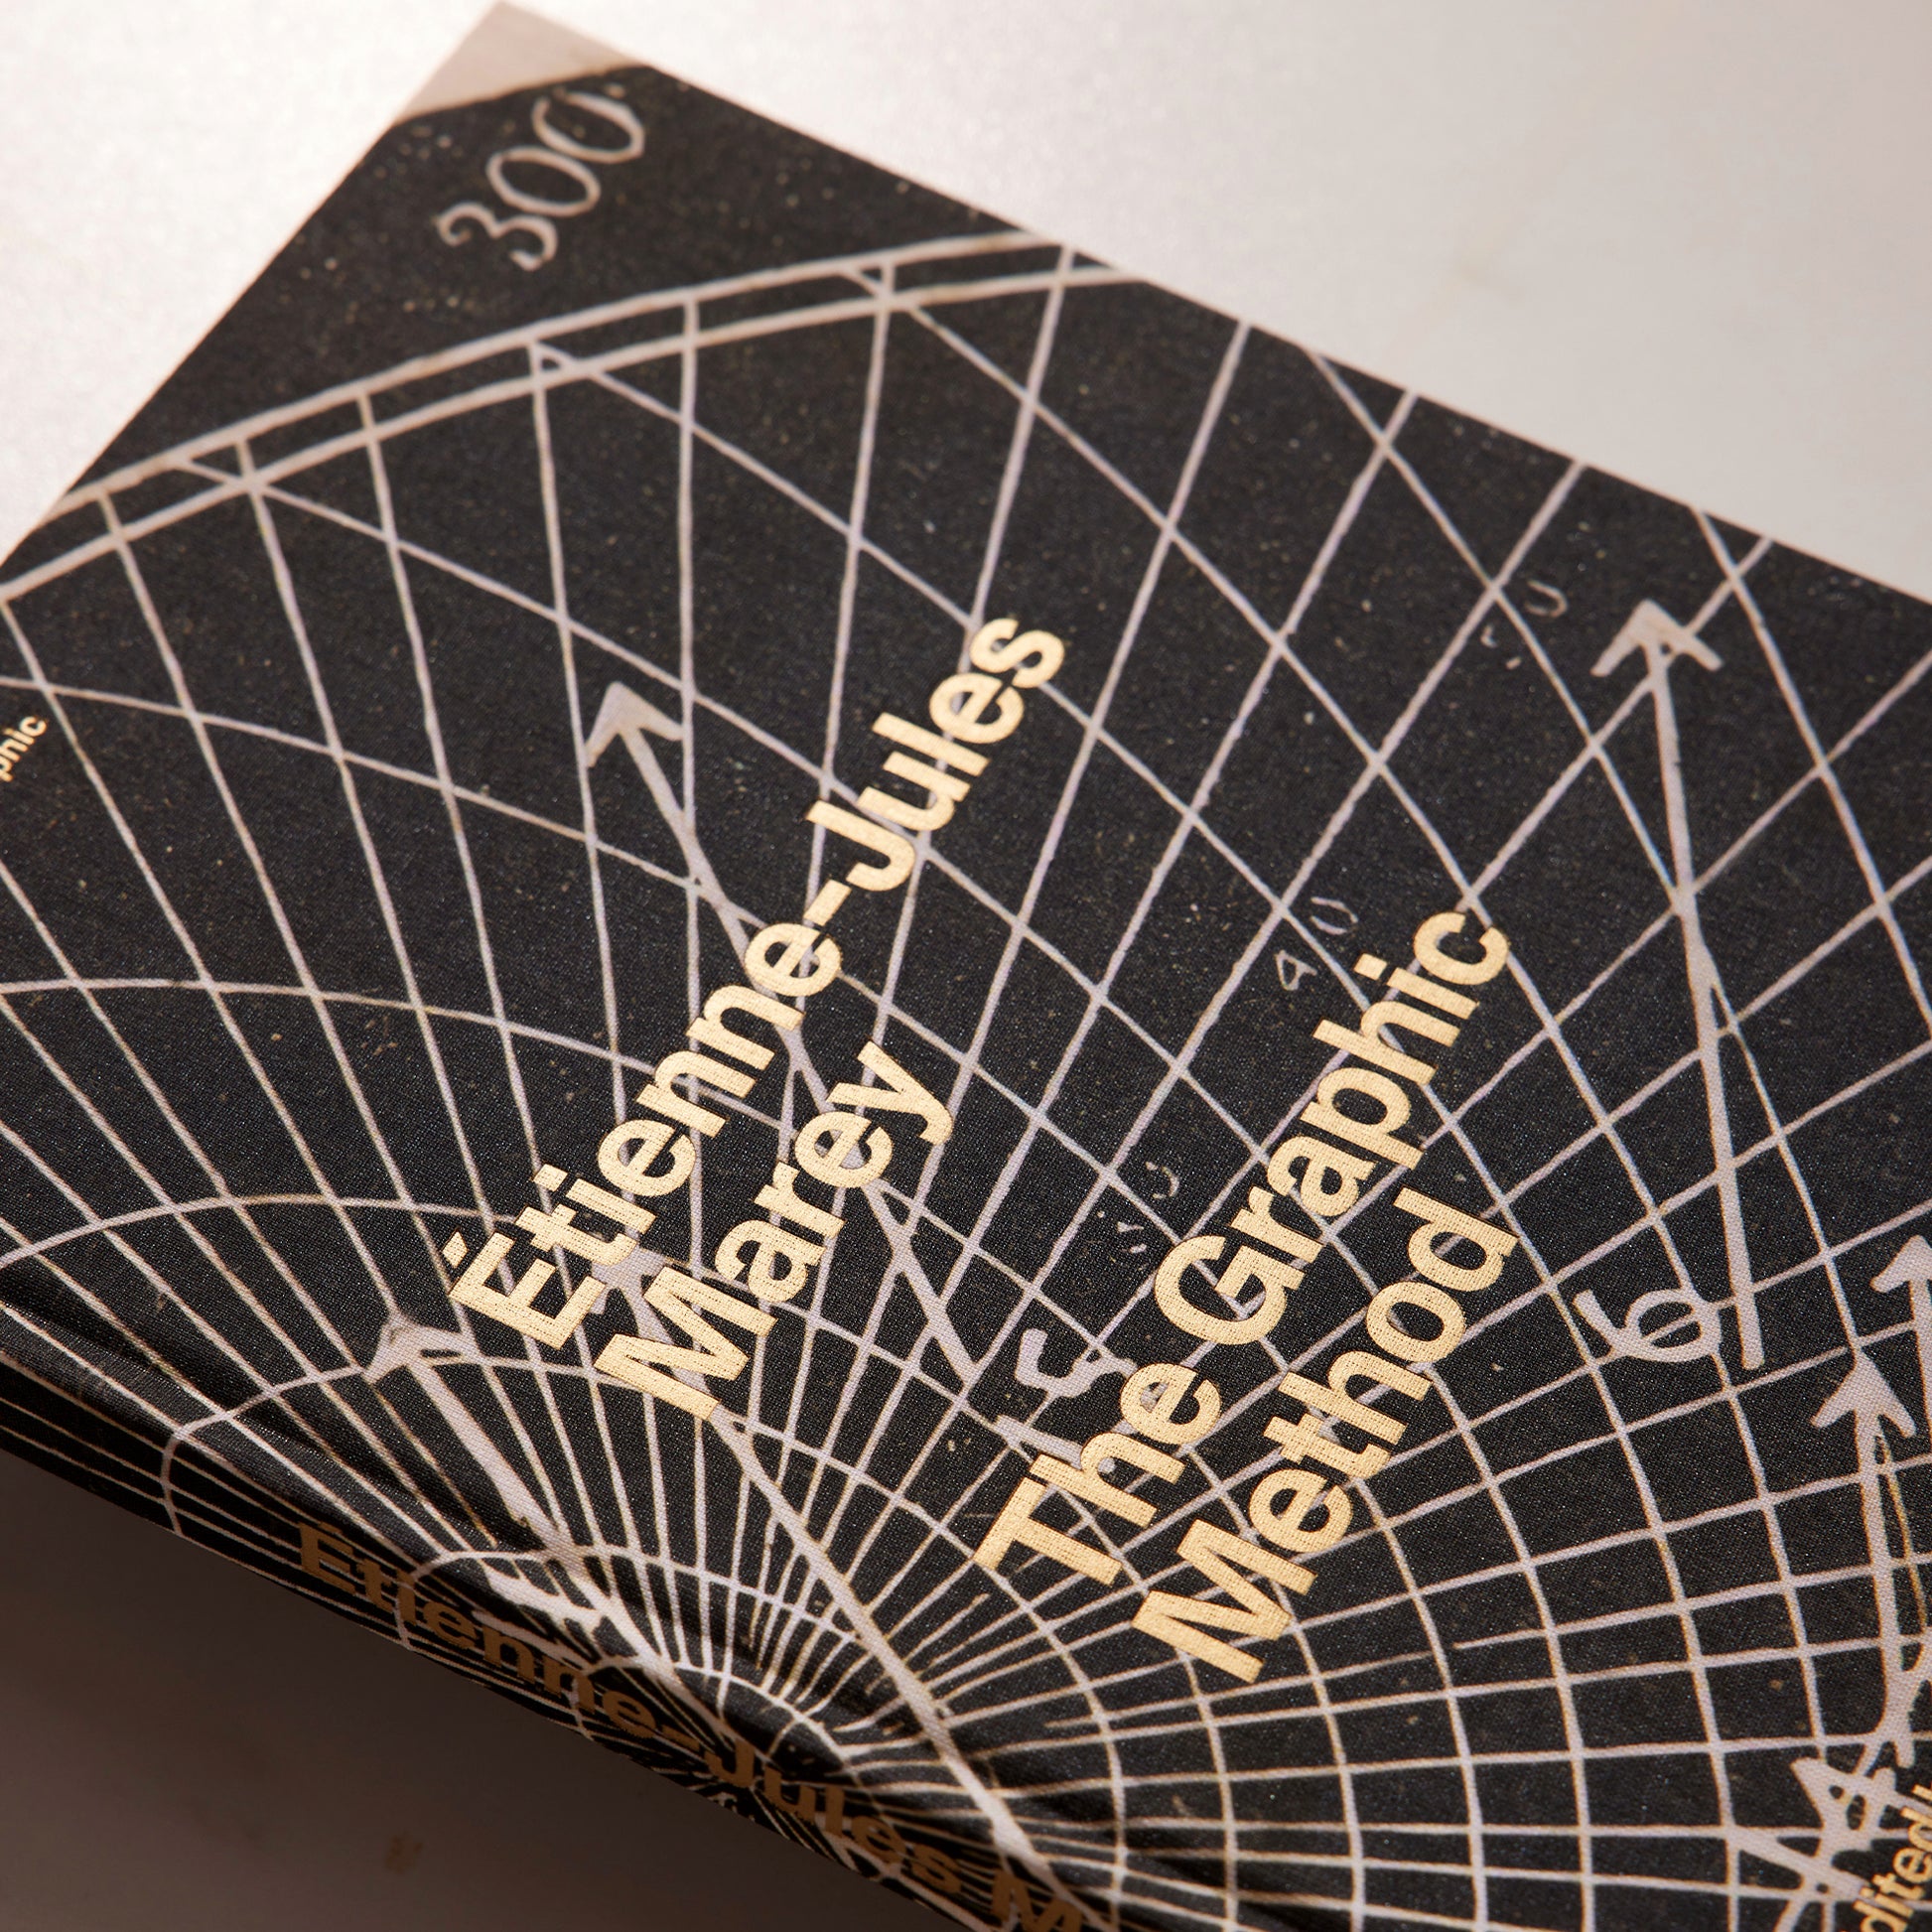
Étienne-Jules Marey, The Graphic Method
Étienne-Jules Marey, The Graphic Method
Couldn't load pickup availability
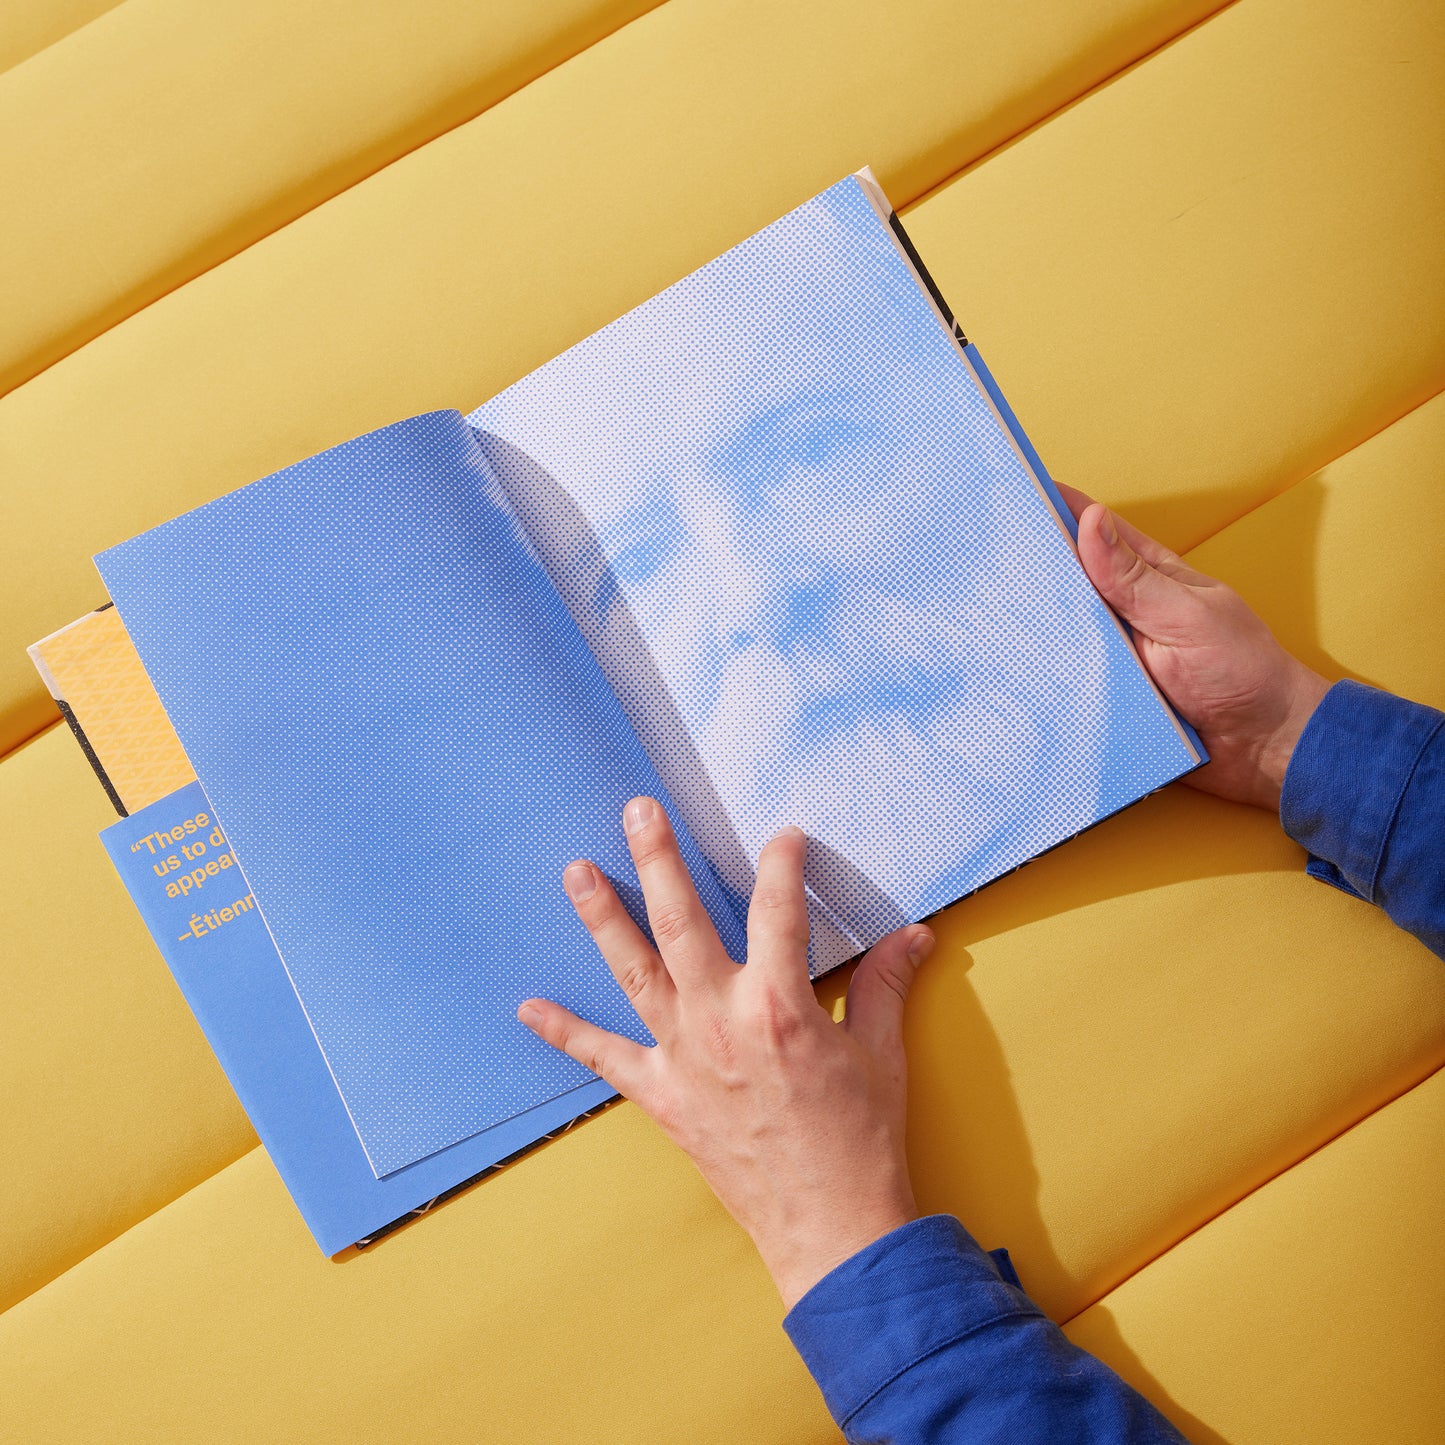
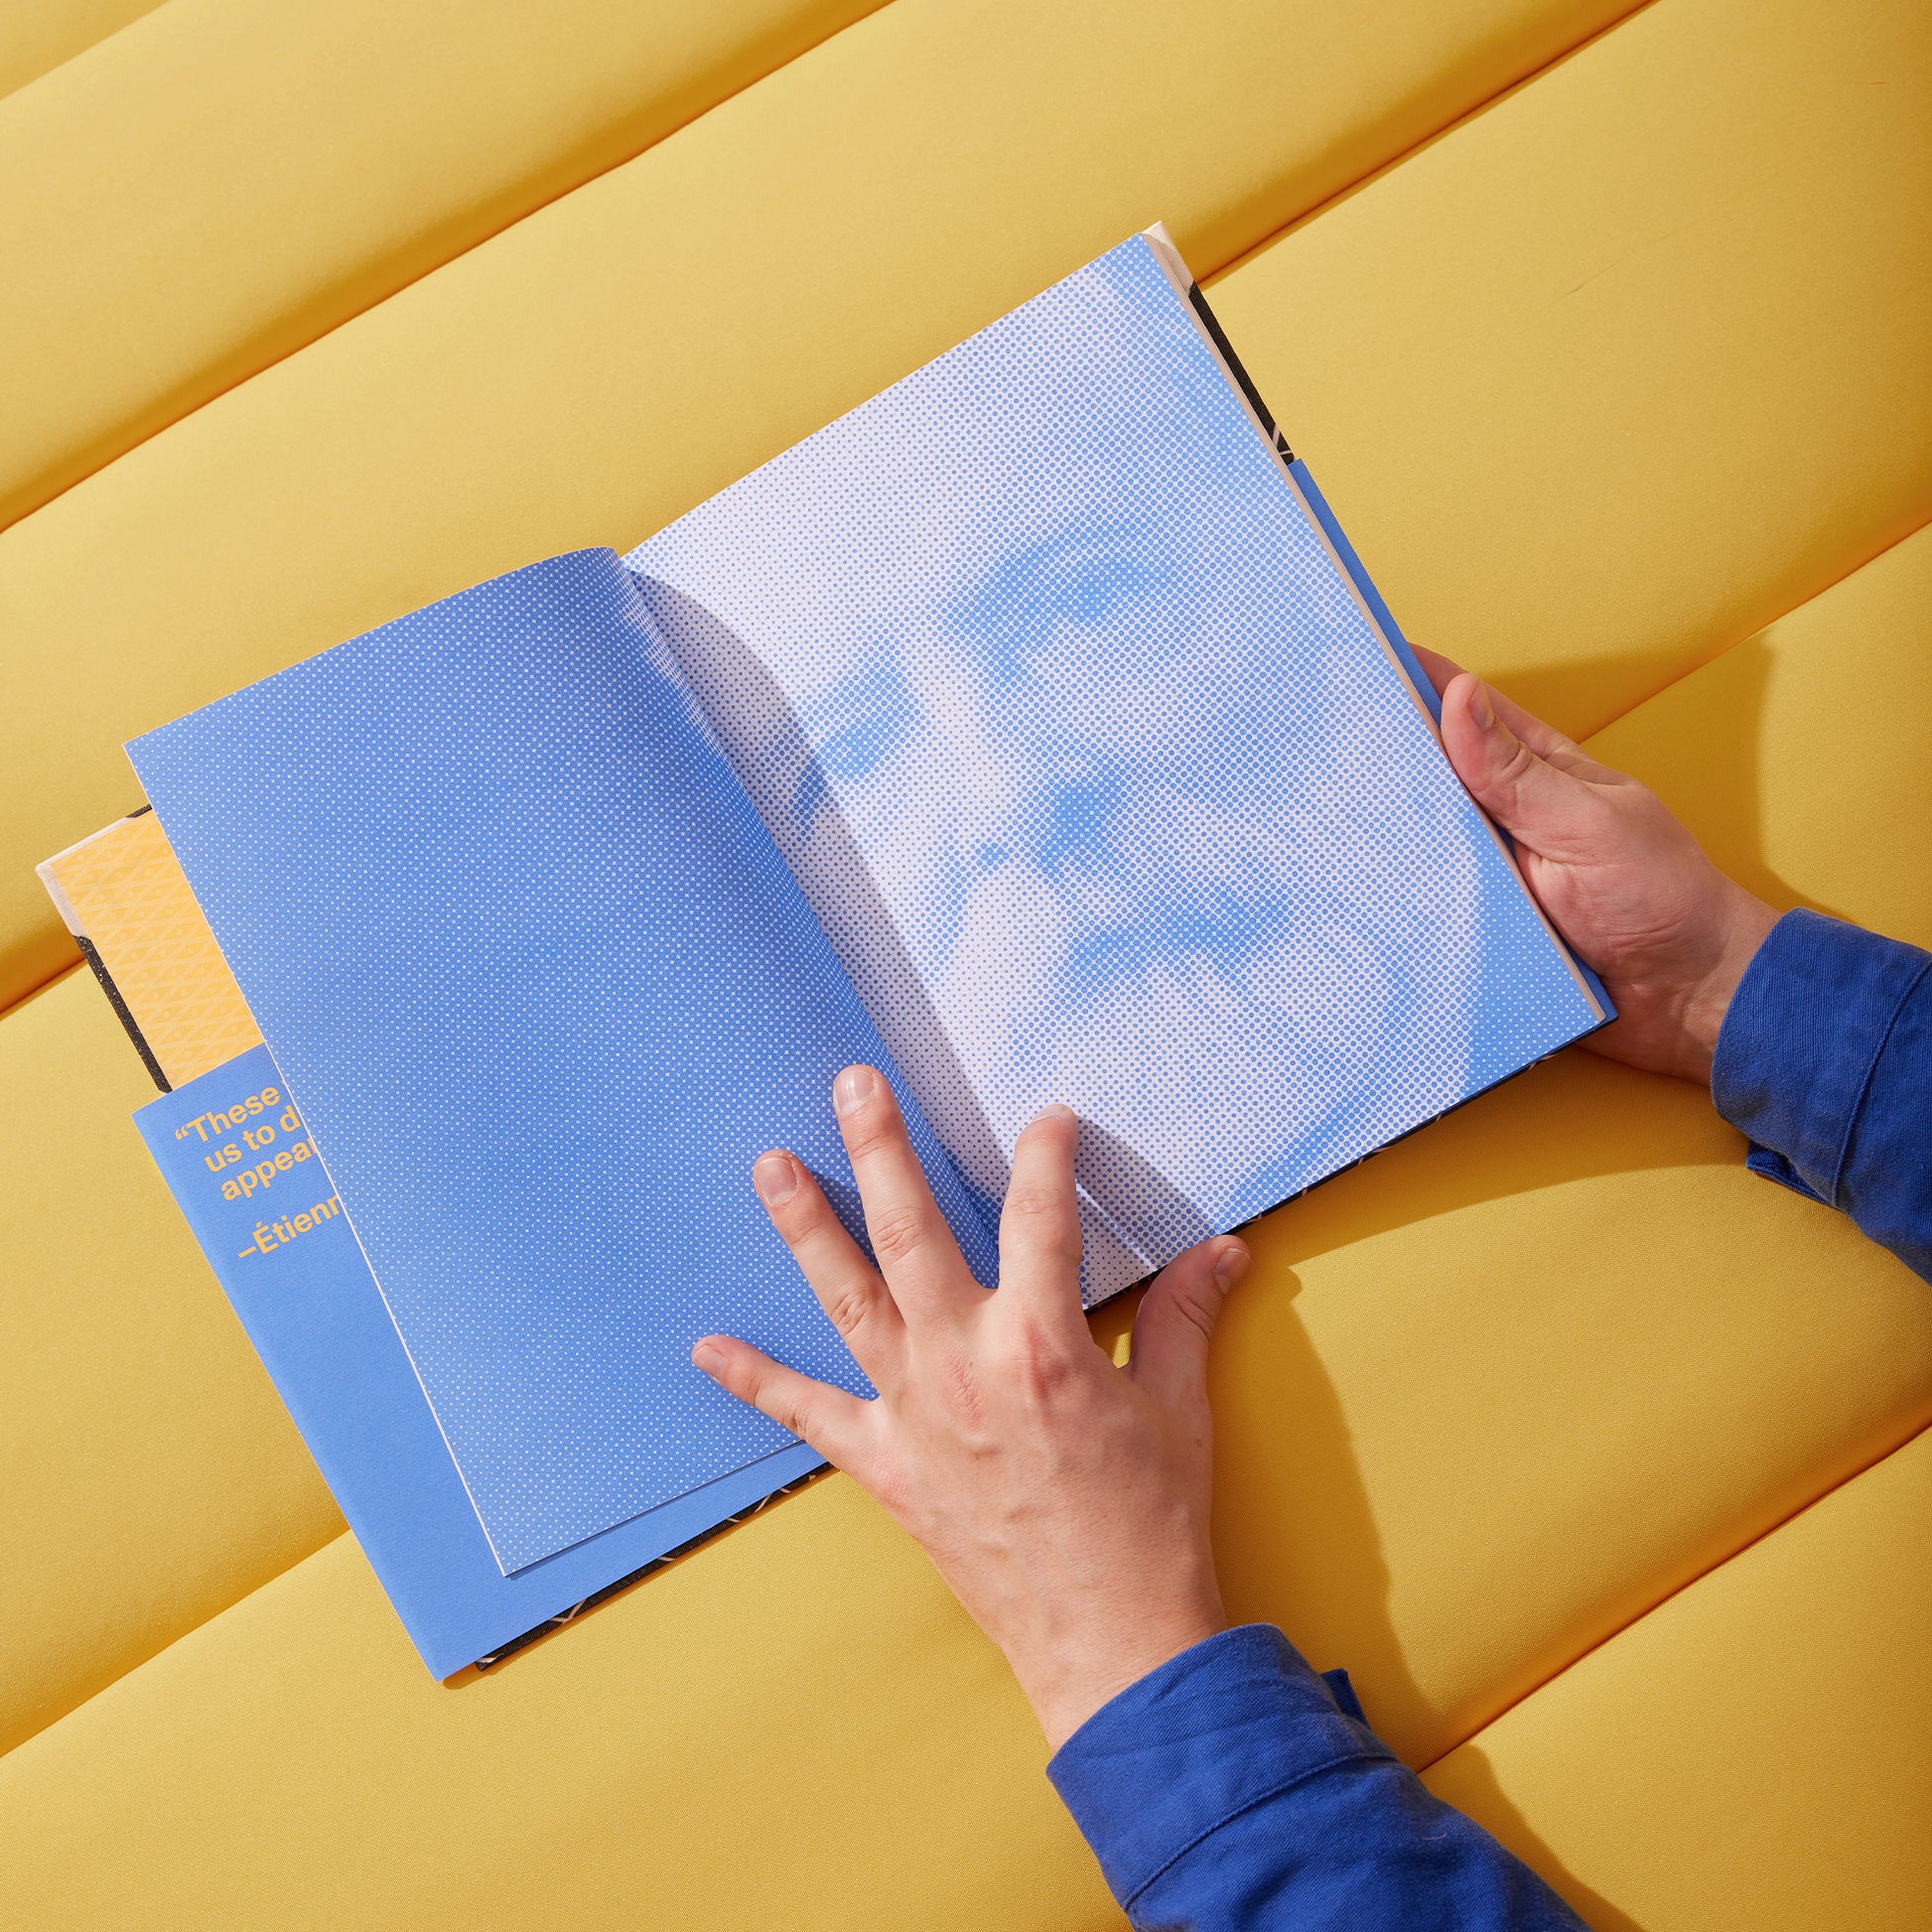
“These views have taught us to discern the appearances of reality.”— Étienne-Jules Marey, 1878
Overview
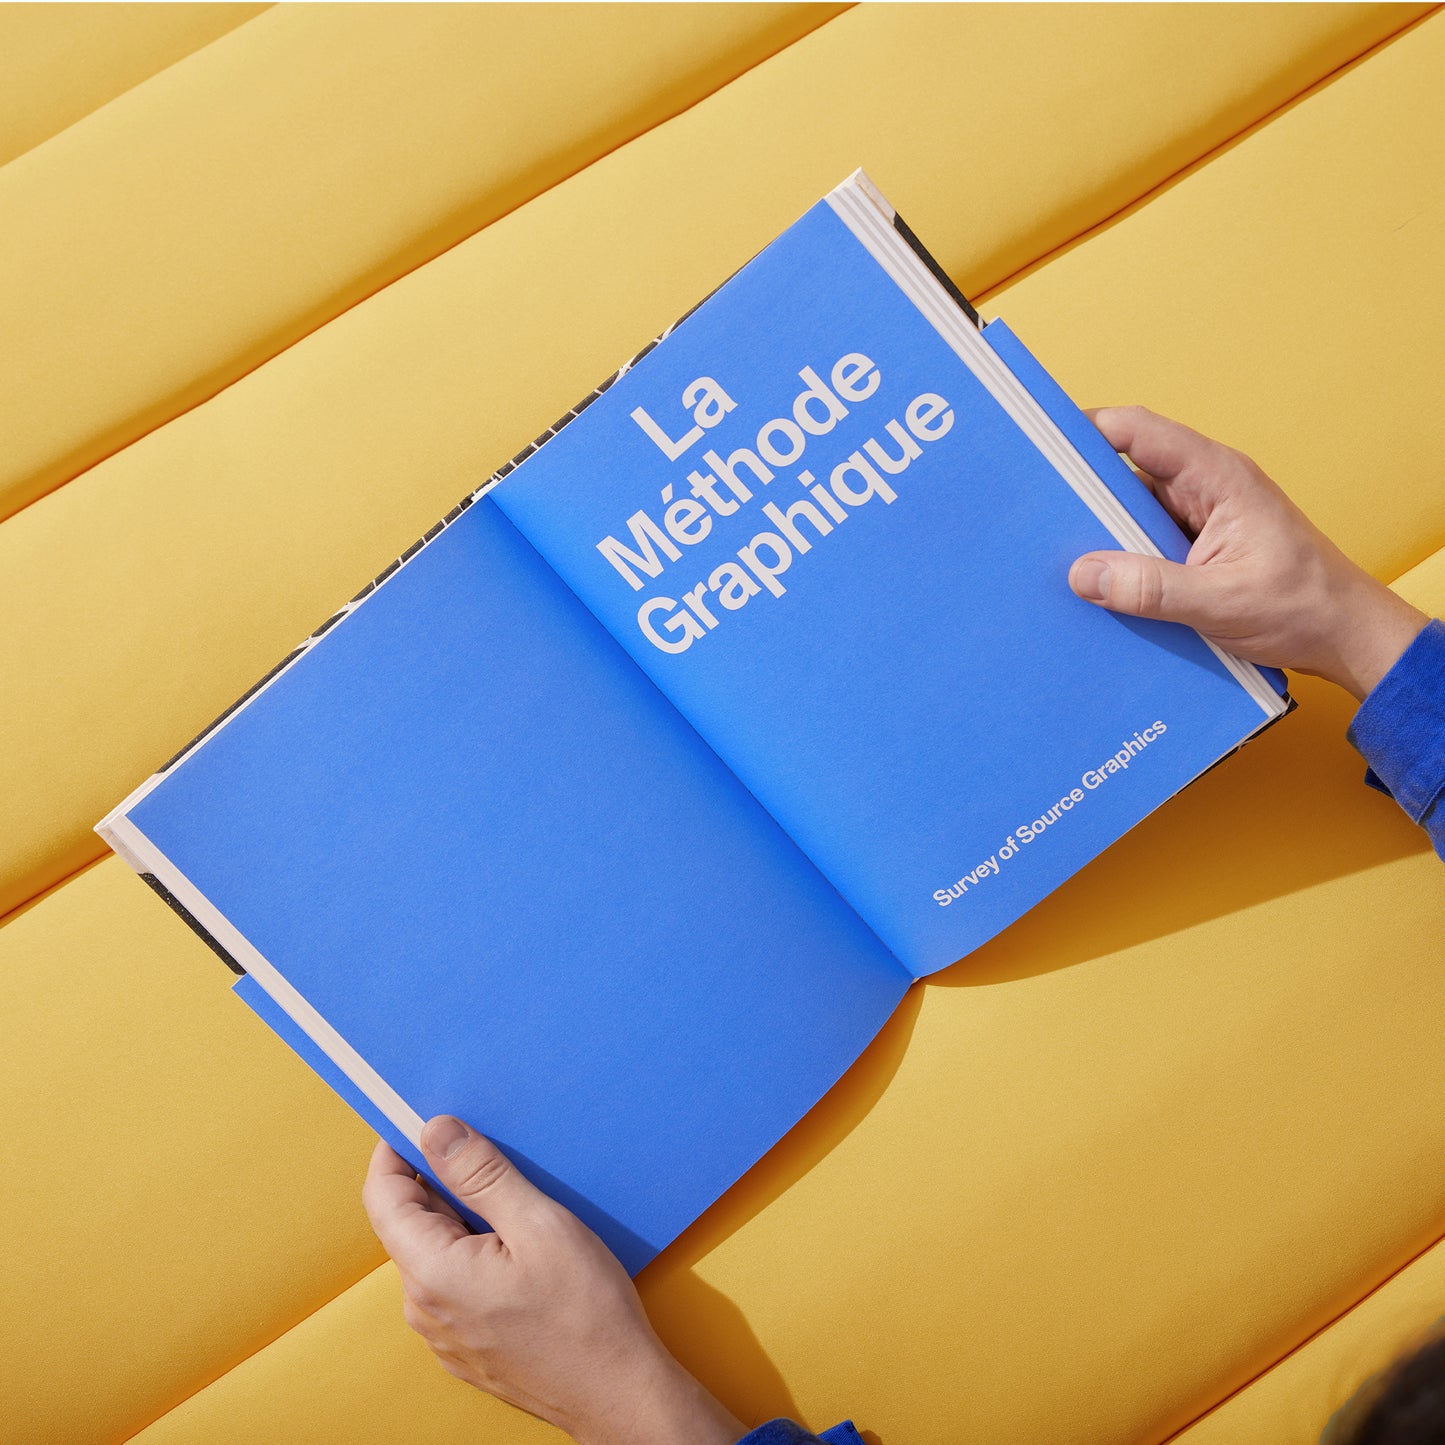
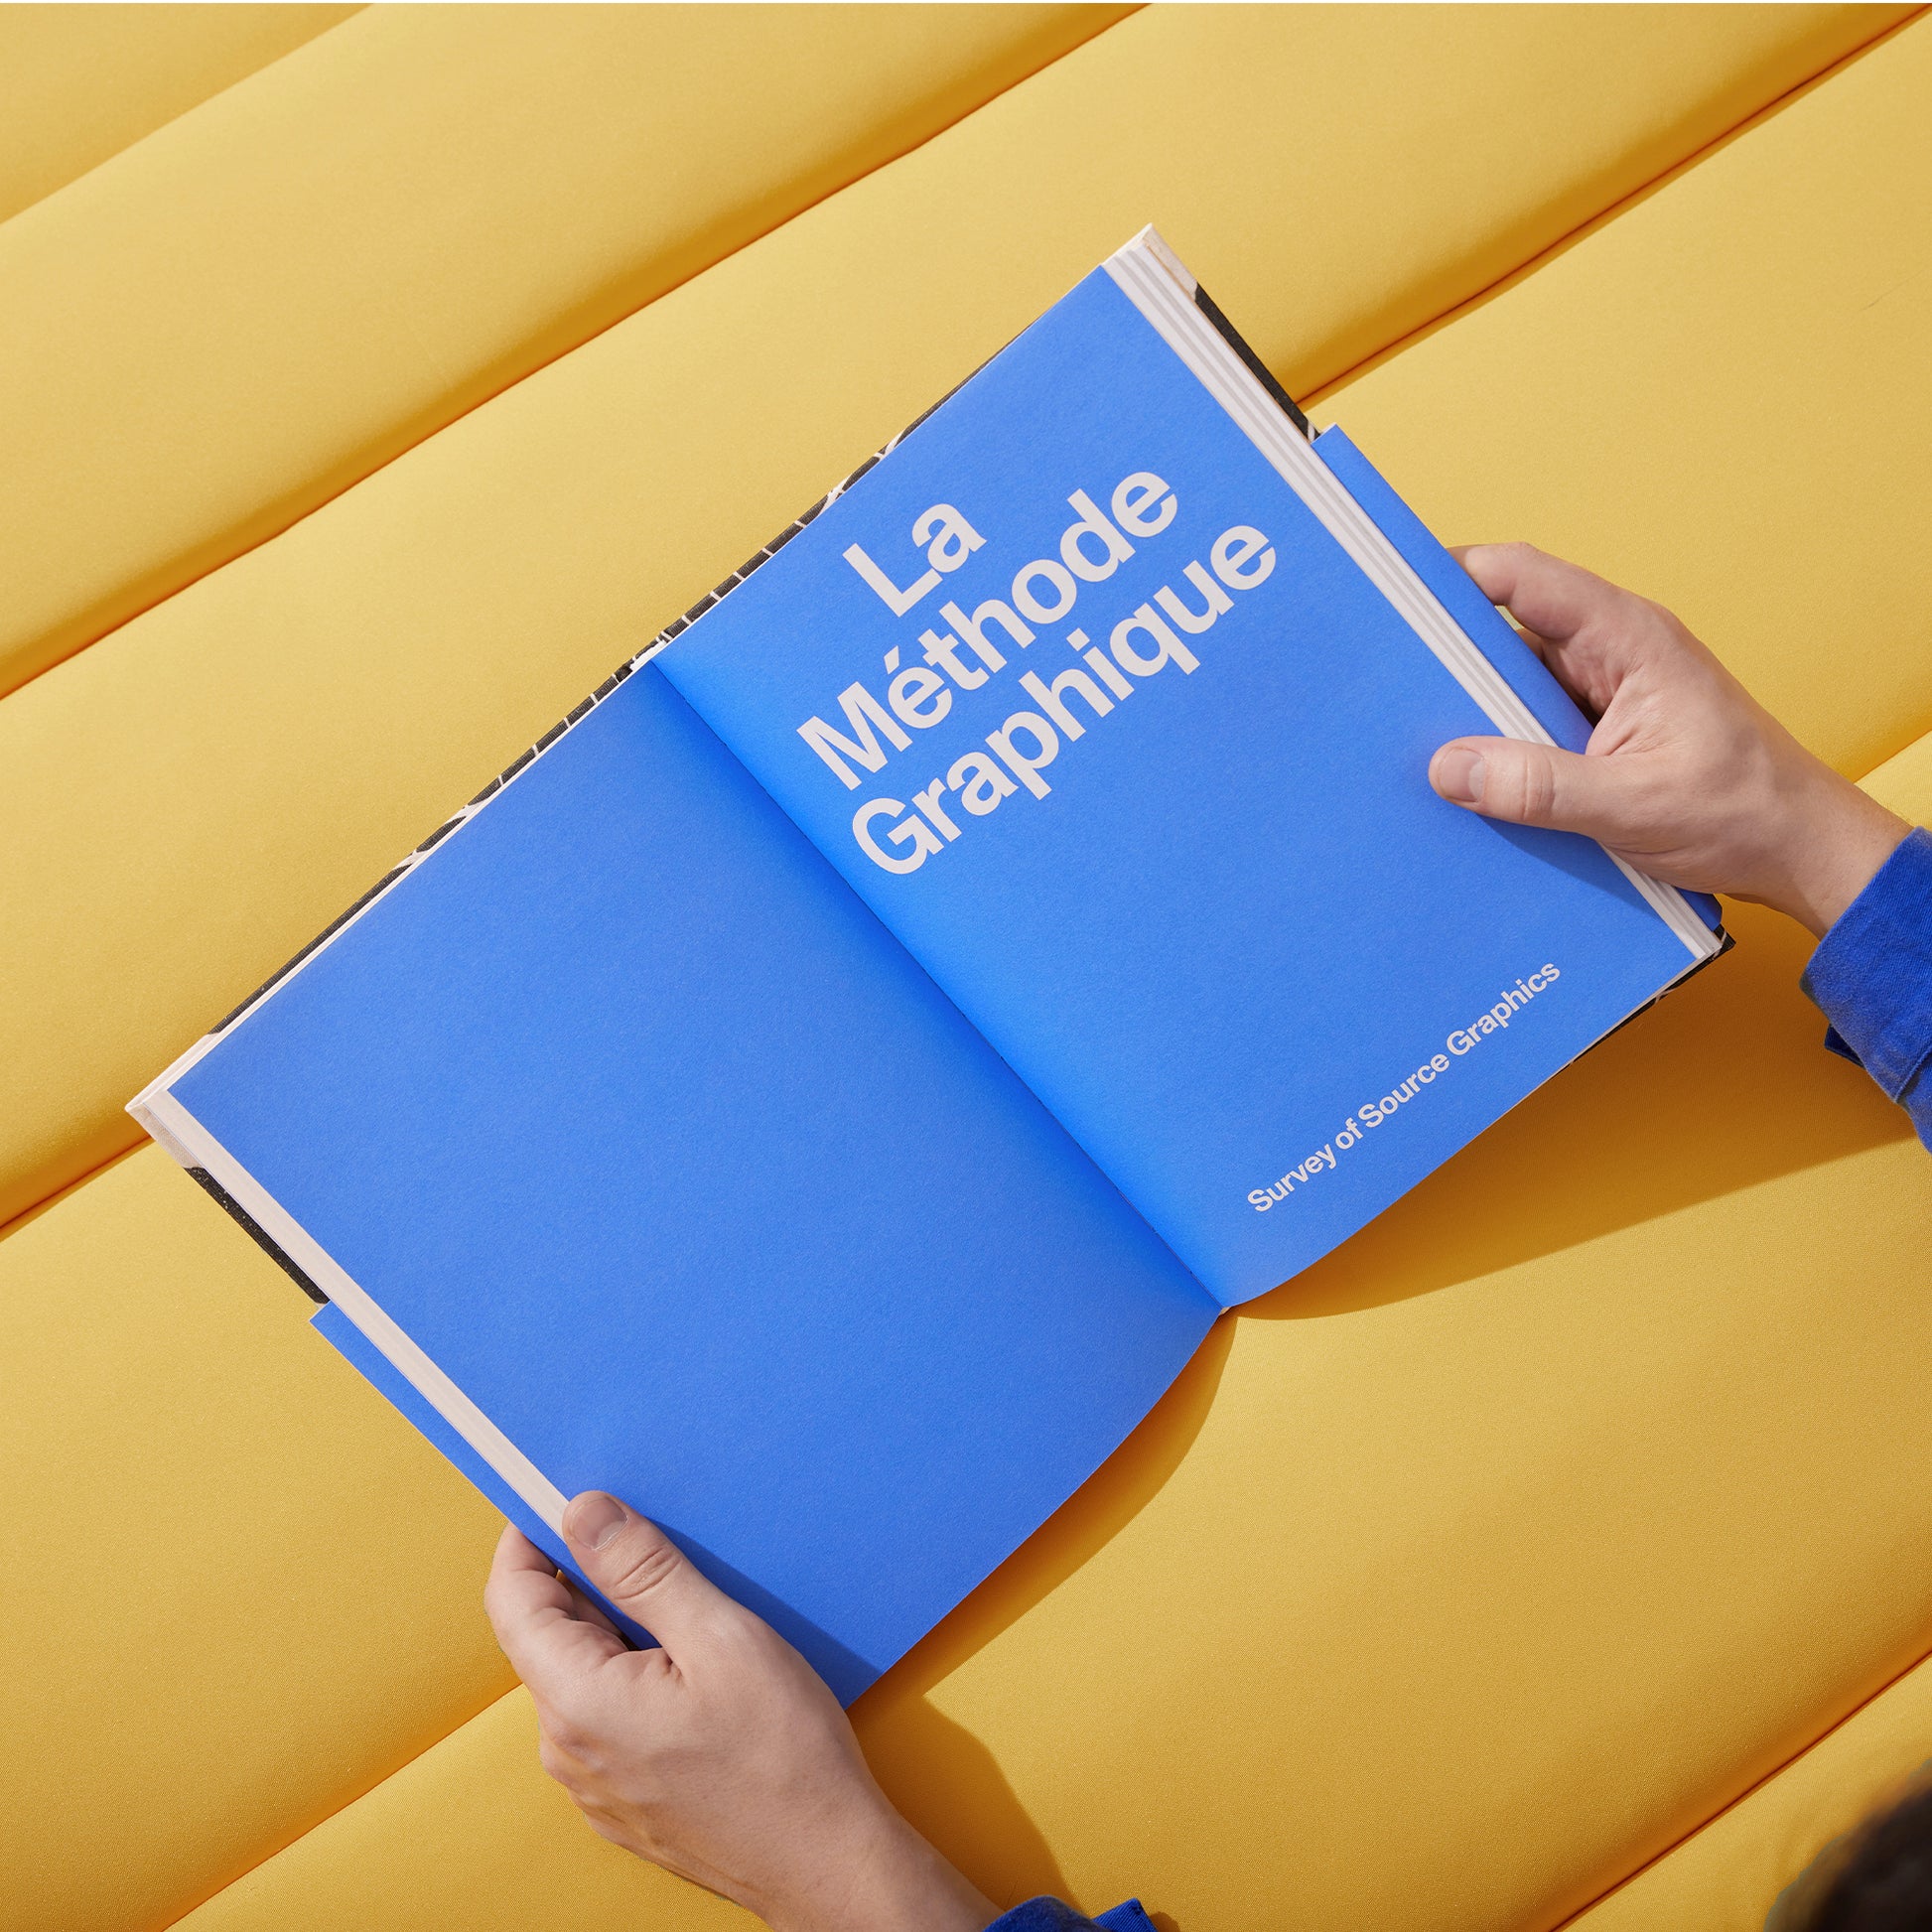
Étienne-Jules Marey revealed to the human eye what it cannot naturally see; changing not only science, but cinema and art too. His poetic book, titled La Méthode Graphique, was the first major treatise on data graphics and has been treasured by insiders for over a century.
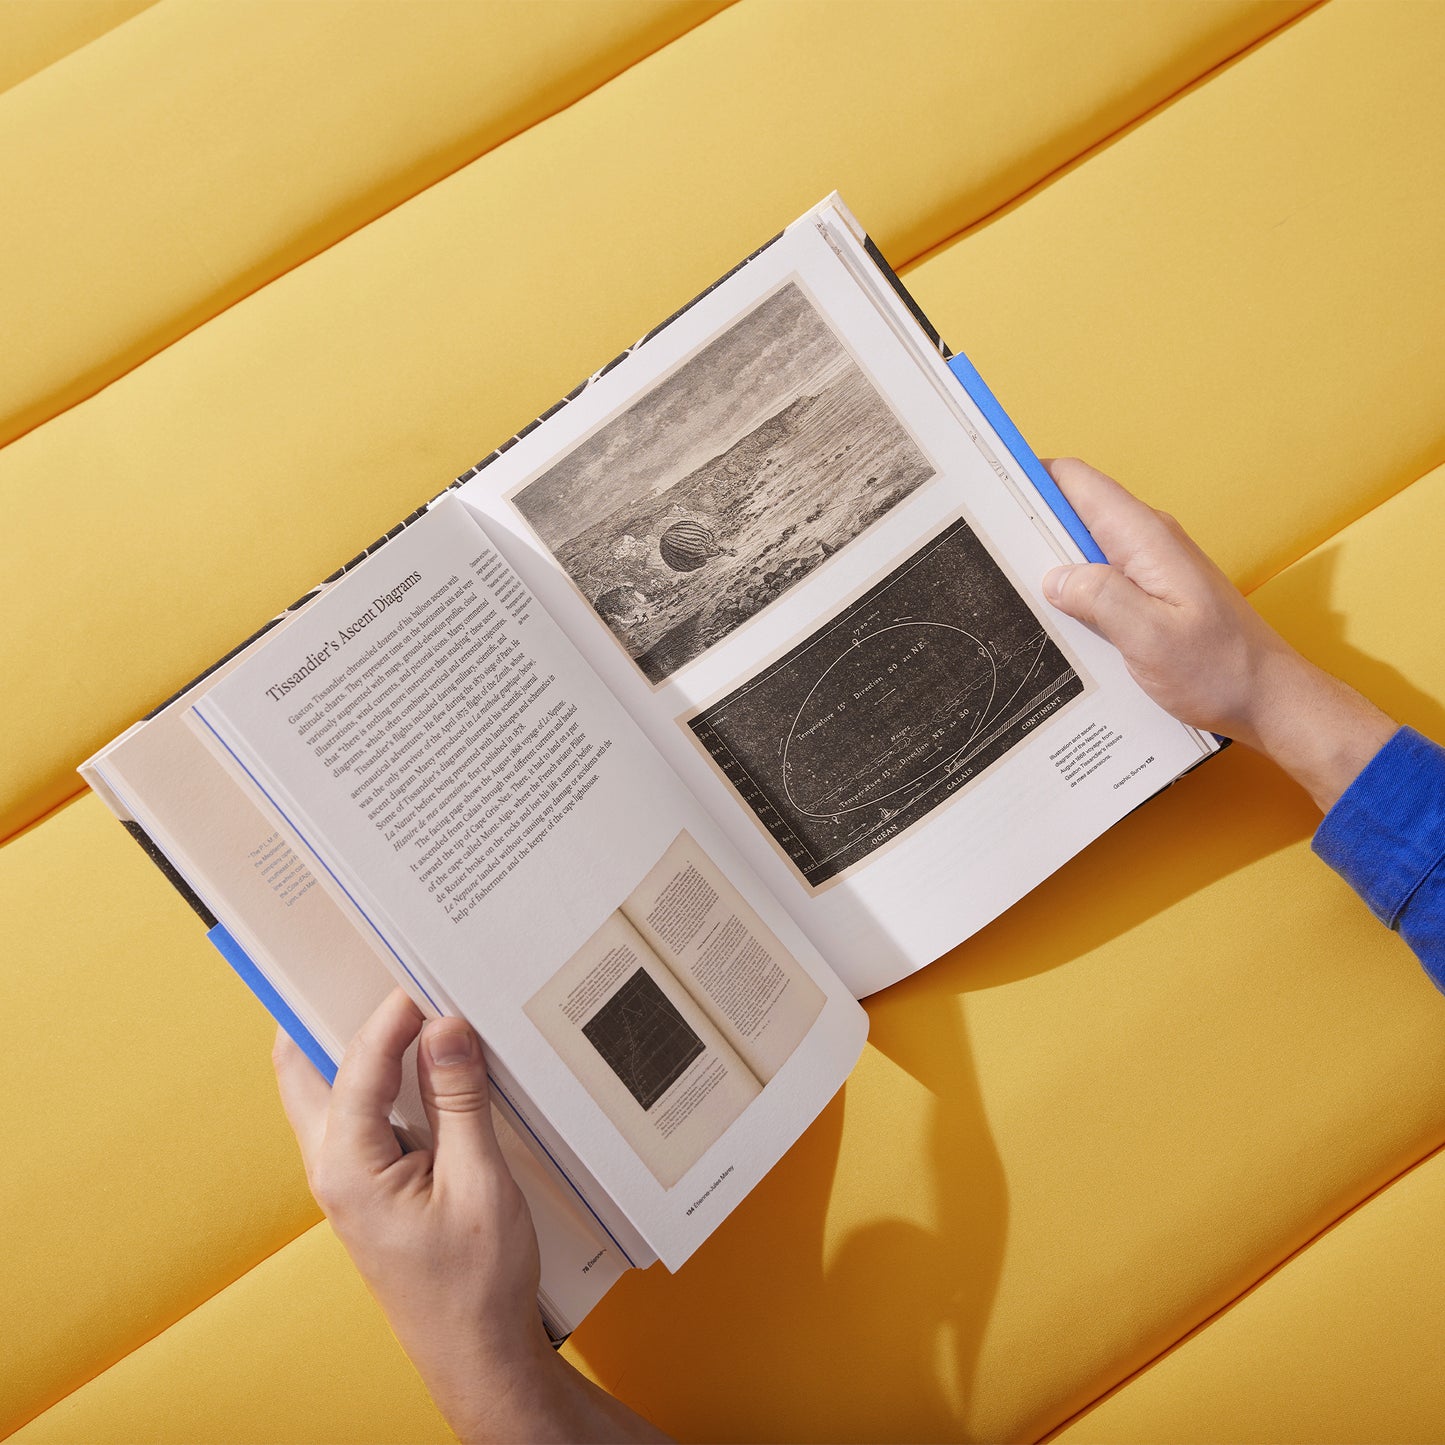
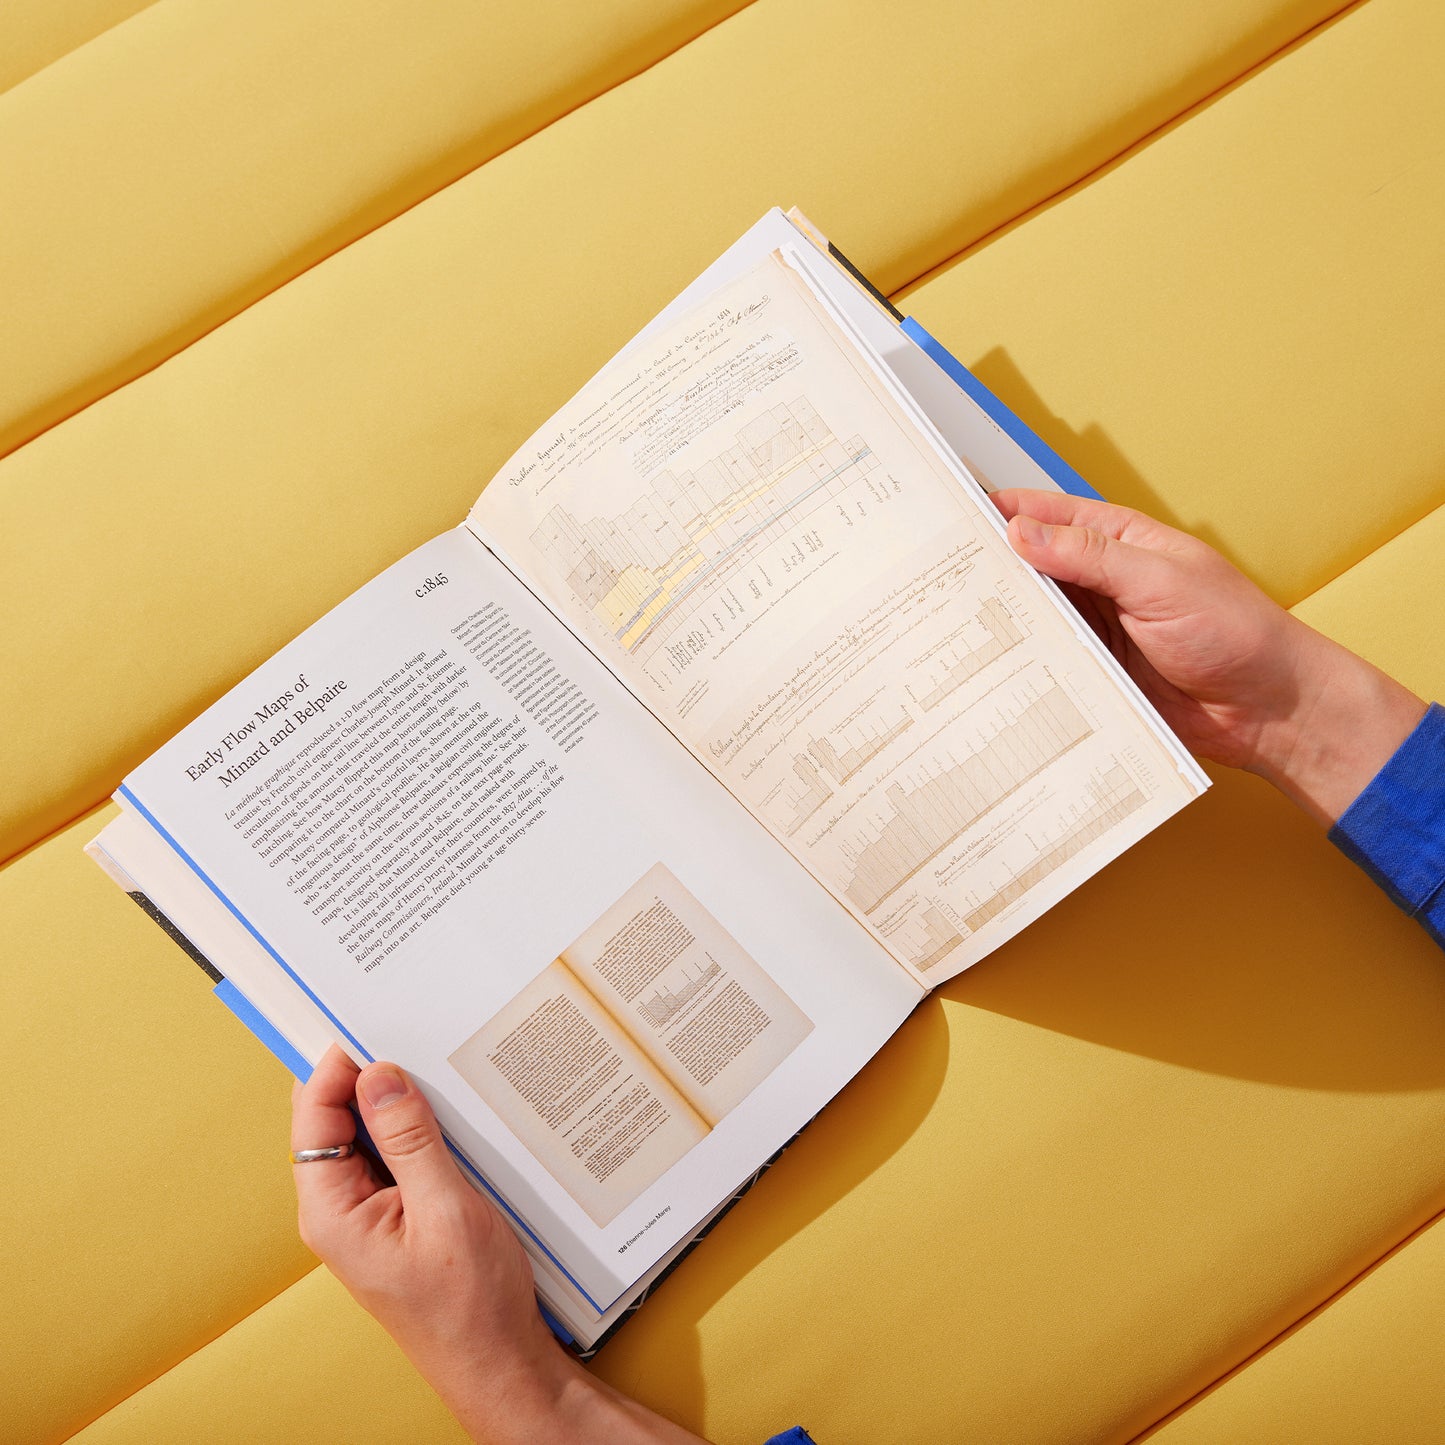
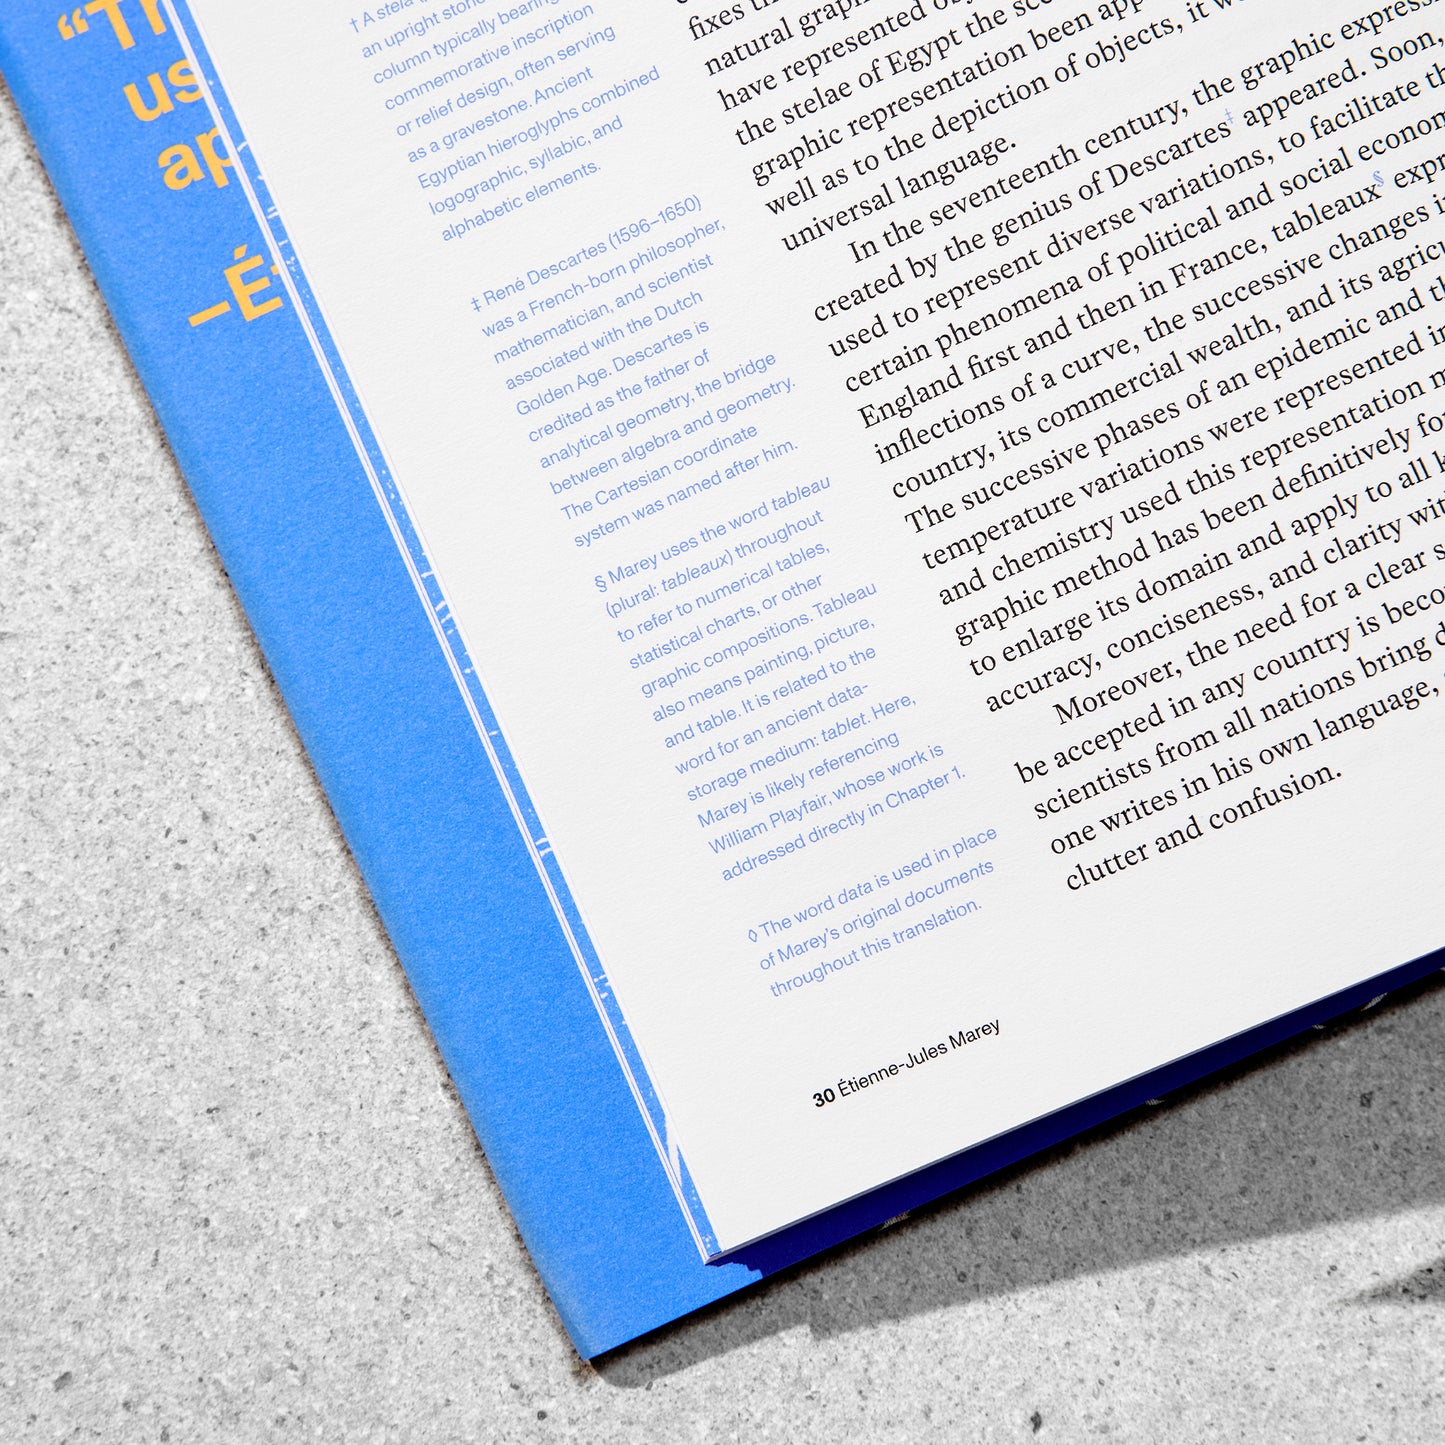
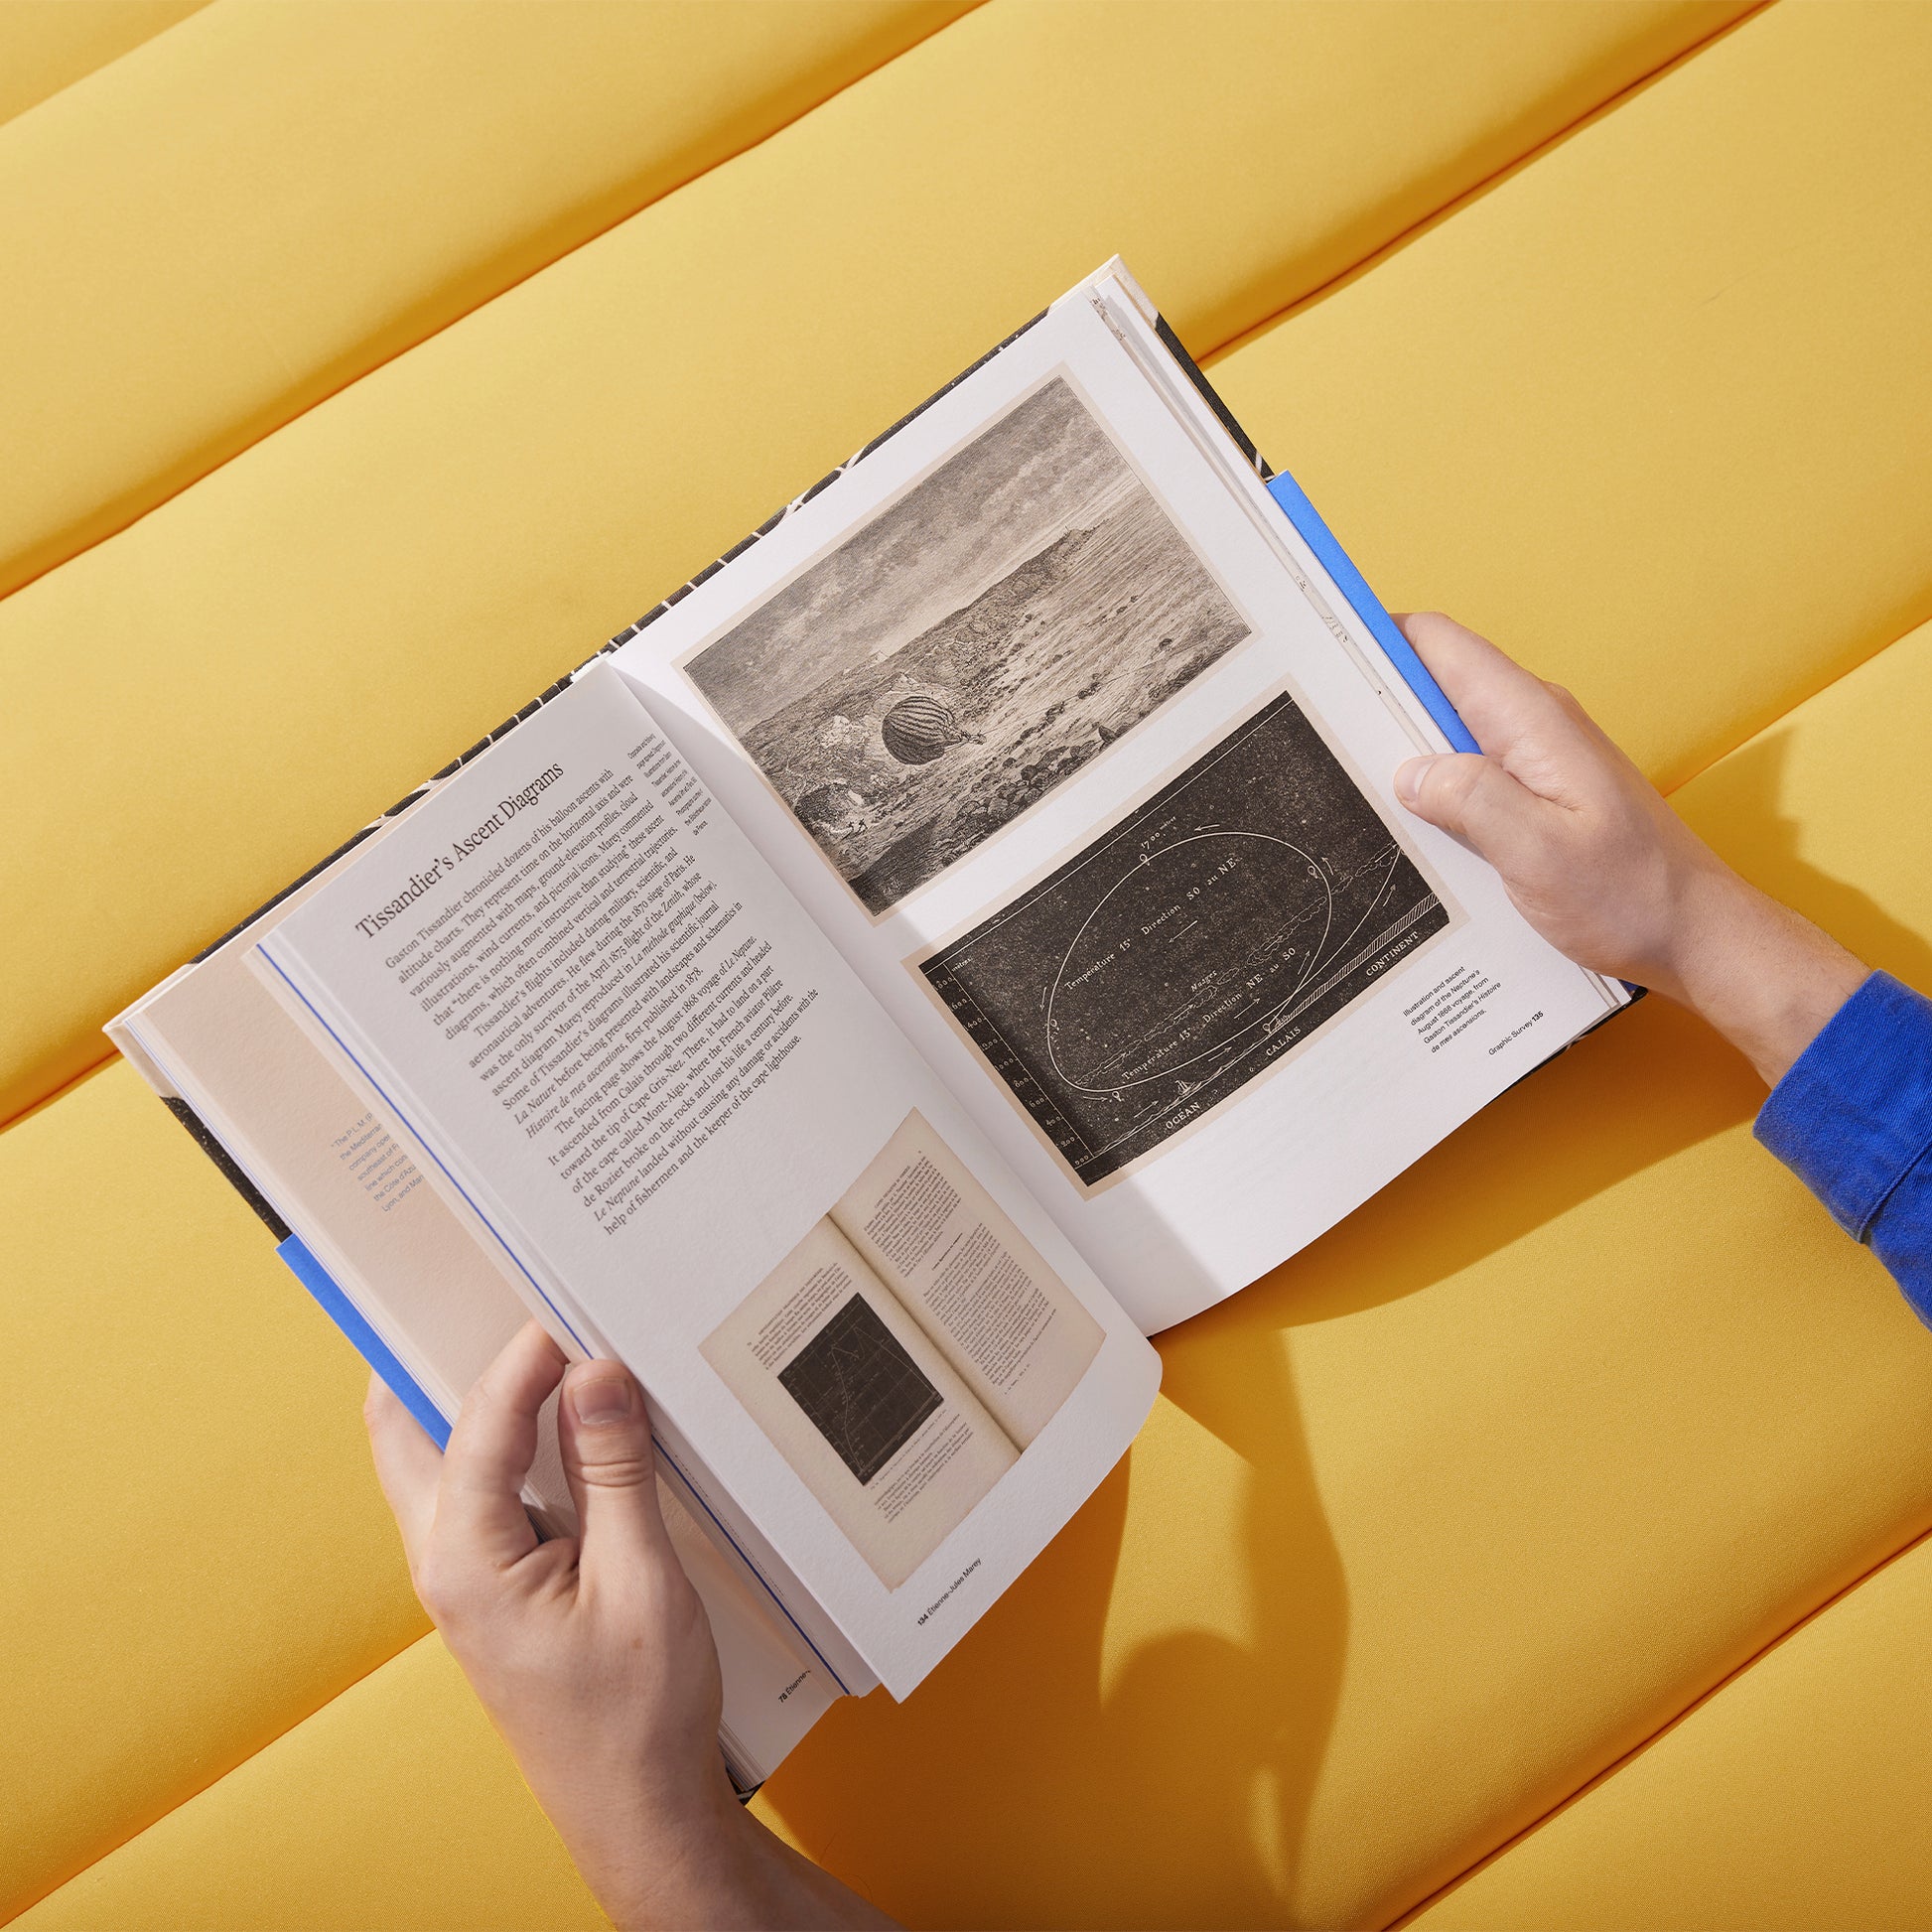
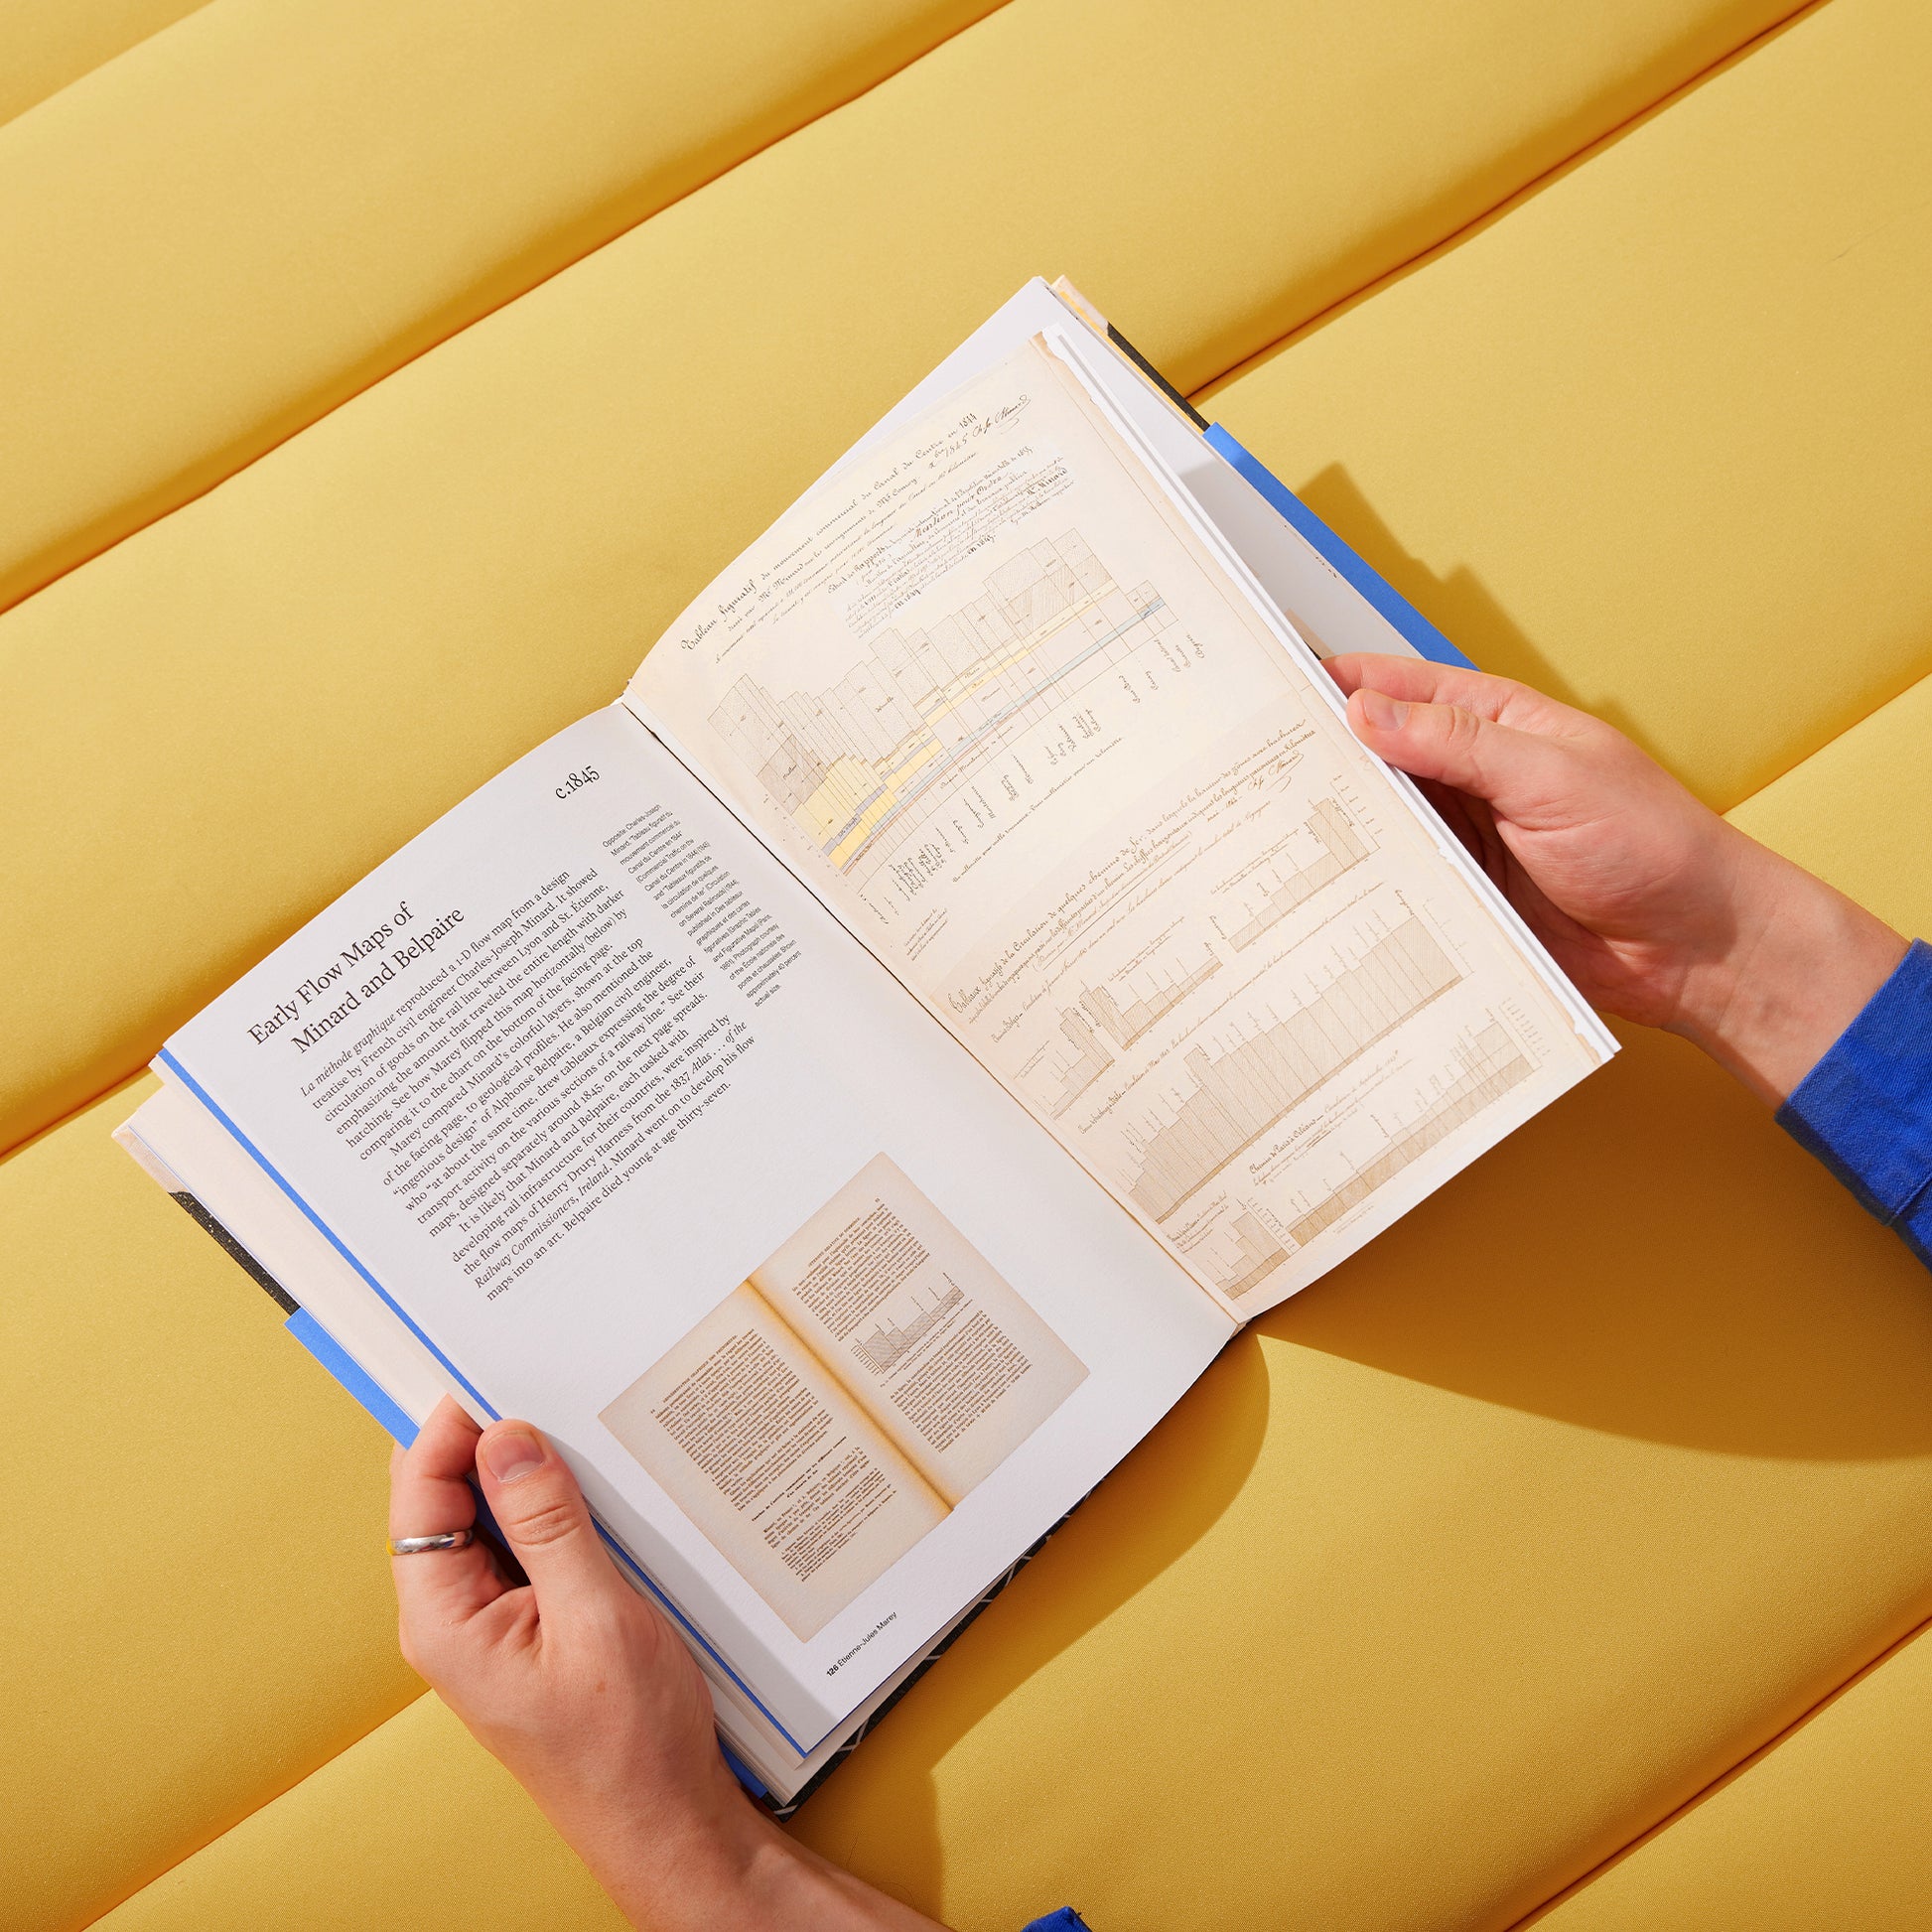
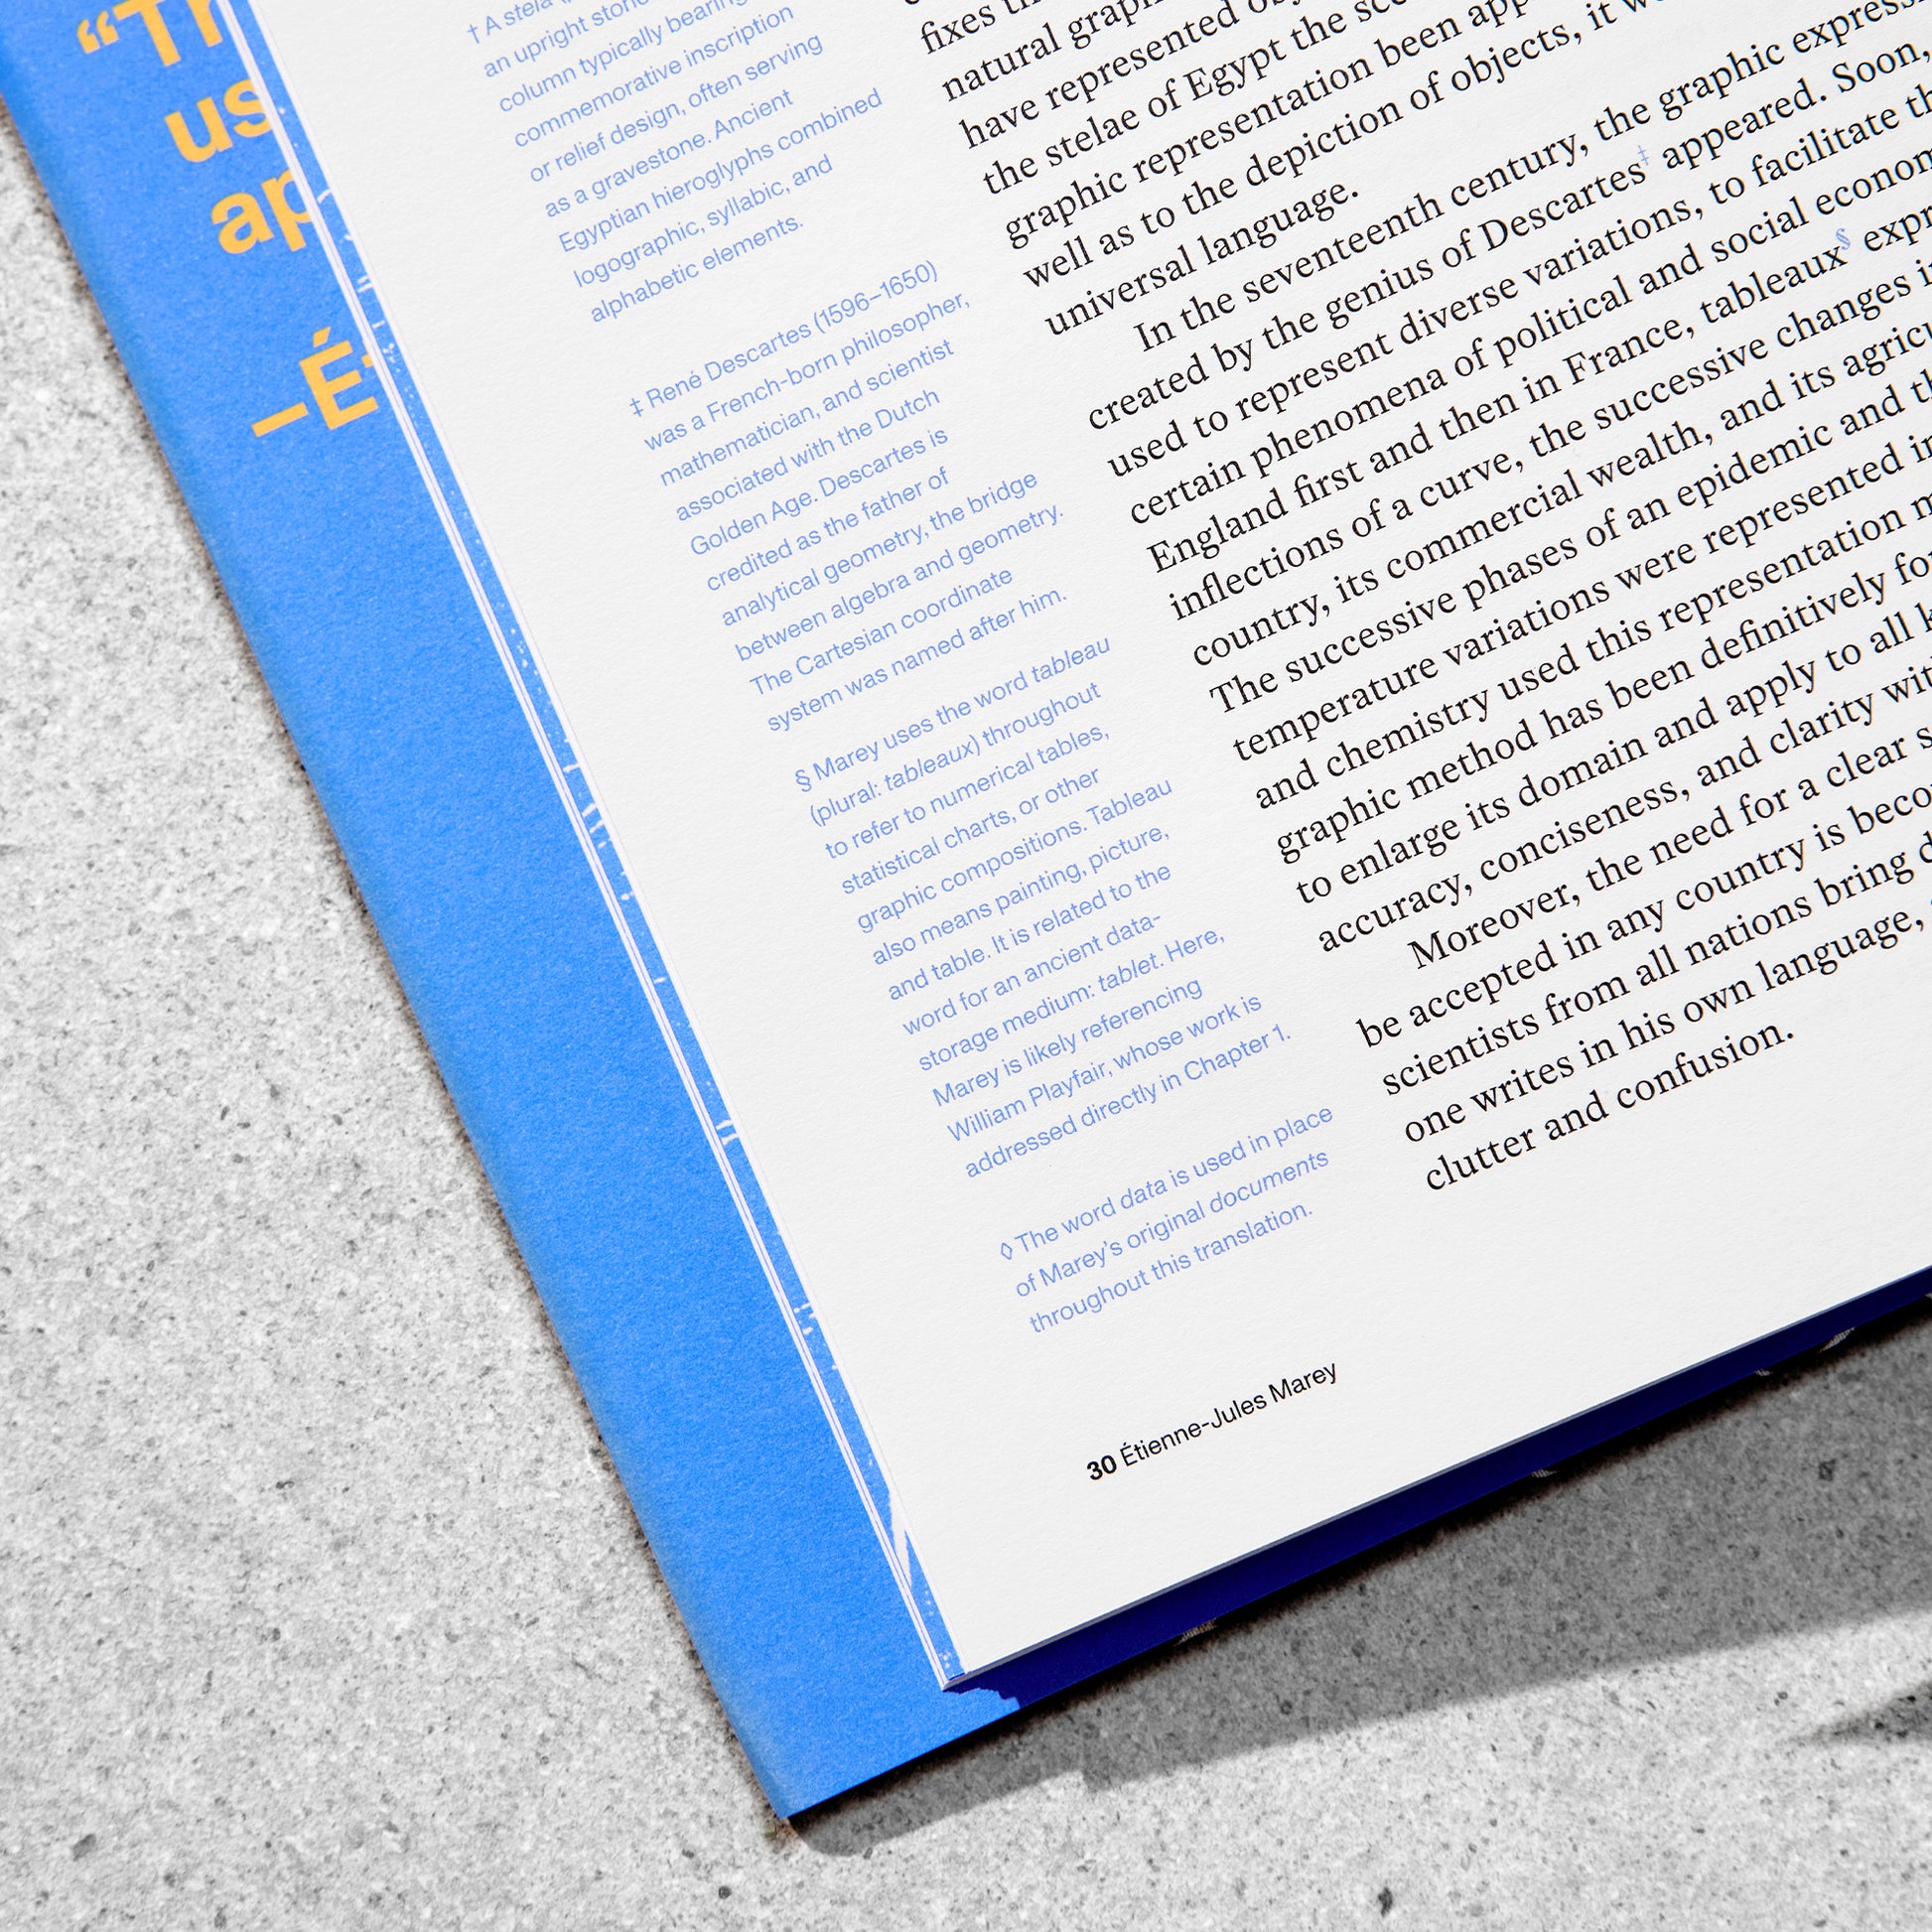
This volume publishes the first English translation of The Graphic Method, Part One. It is illustrated by original photography of Marey’s original fifty-one figures. New margin notes about historic scientists and technologies by Georges Hattab and RJ Andrews complement their translation.
The translation is introduced by a new essay on Marey’s life by Marta Braun, historian of chronophotography. The book concludes with a colorful survey of rare information graphics referenced by Marey, presented with comparative analysis between his figures and the work he sampled.
Book Details
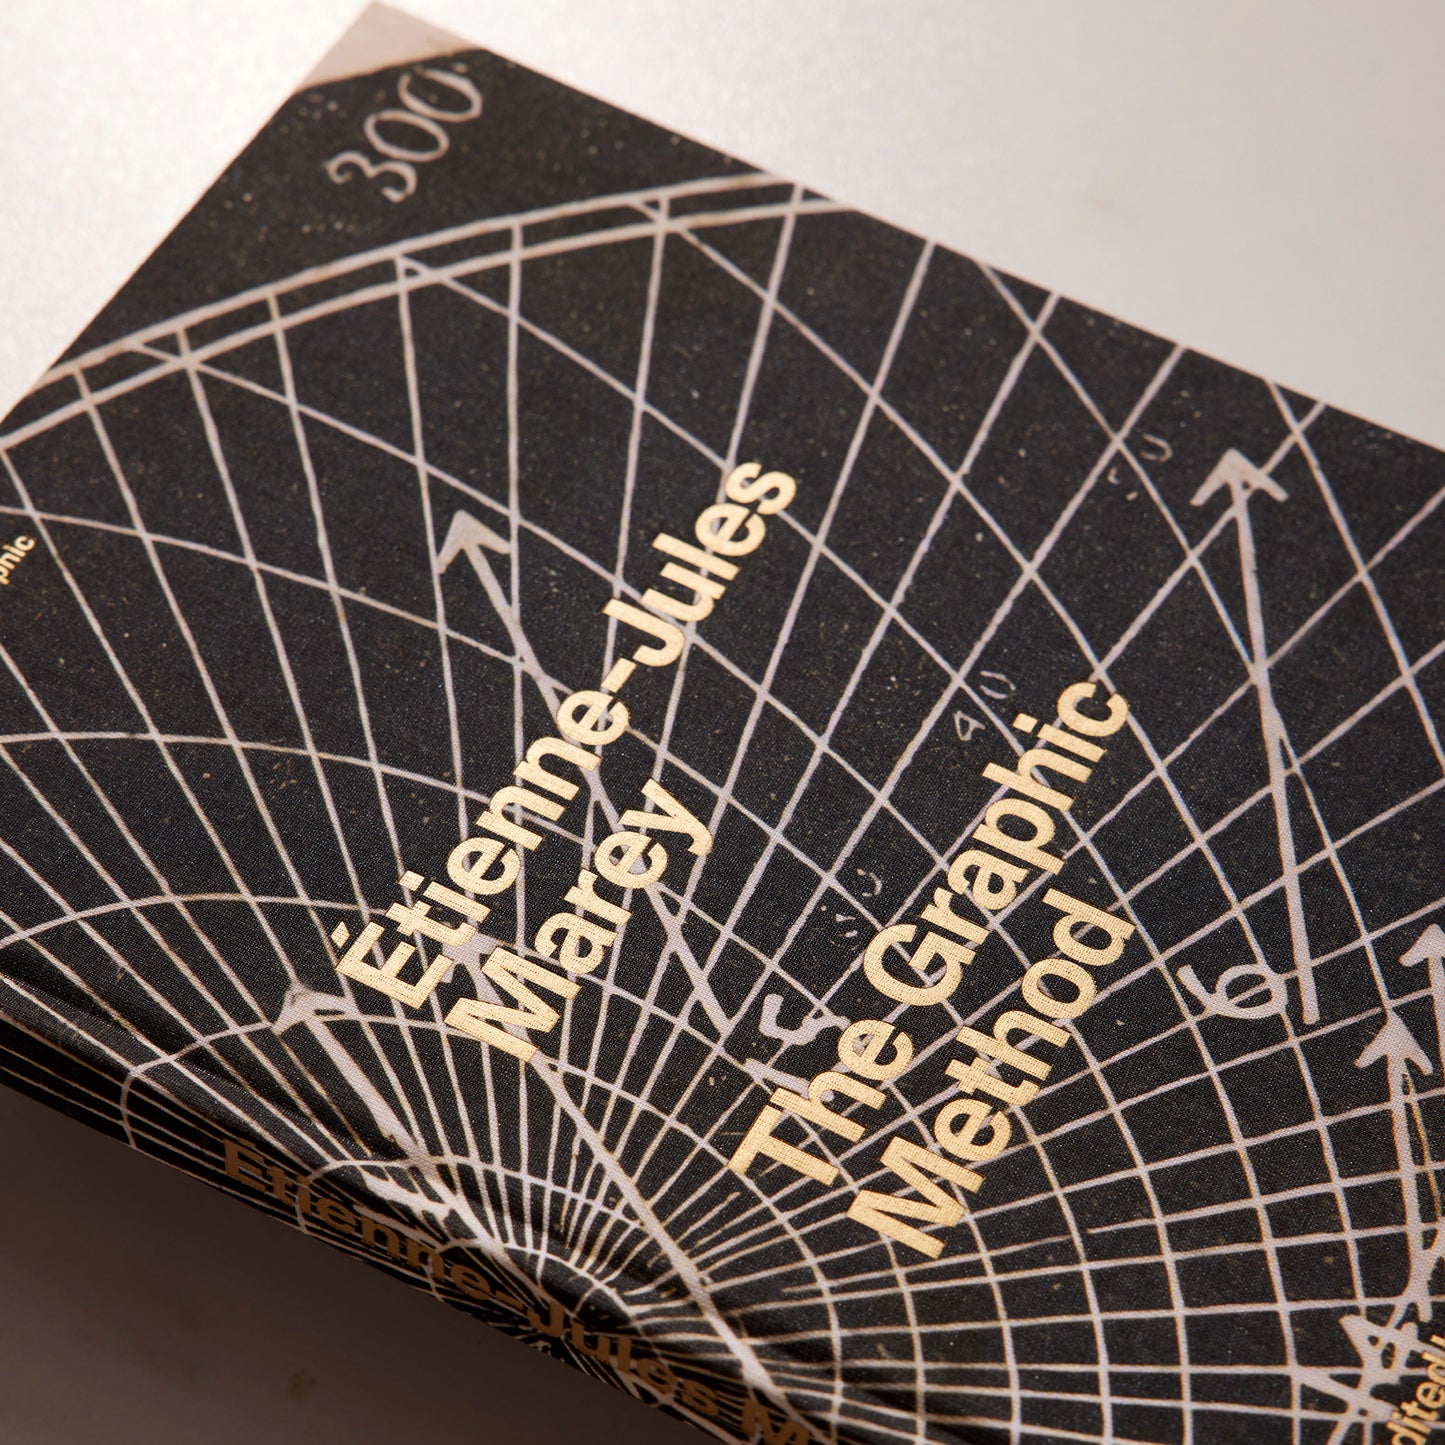
Hardcover cloth with gold foil stamp lettering
Partial dust jacket printed with PMS colors
11 × 7.8 inches (199 × 279 mm) trim size
168 pages
116 illustrations
Printed in Italy
2022 Publication
ISBN: 979-8-9861945-2-3
Contents
Preface by Georges Hattab & RJ Andrews
“From the Atom to the Heavens” by Marta Braun
The Graphic Method, Introduction and Part One by Étienne-Jules Marey
Translated and Edited by Georges Hattab & RJ Andrews
La Méthode Graphique, Survey of Source Graphics
About the Editors
Georges Hattab PhD is a French scientist interested in highdimensional data from the study of living organisms. He leads the Visualization Group at the Center for Artificial Intelligence for Public Health at the Robert Koch Institute near Berlin, Germany. There, Hattab focuses on developing computational solutions at the interface of visualization and artificial intelligence. He also solves problems that arise in data visualization, such as uncertainty, accessibility, and bias in rendered visualizations.
RJ Andrews is an American data storyteller and the author of Info We Trust, How to Inspire the World with Data and Florence Nightingale, Mortality and Health Diagrams. He created this book in San Francisco during the Covid-19 pandemic while also advising national public health policy. See his data stories at InfoWeTrust.
About the Series
This volume is part of Information Graphic Visionaries, a book series celebrating spectacular data visualization creators with original research, new writing, and beautiful visual catalogs. Inaugural volumes also include Emma Willard, Maps of History and Florence Nightingale, Mortality and Health Diagrams.
